OVERVIEW
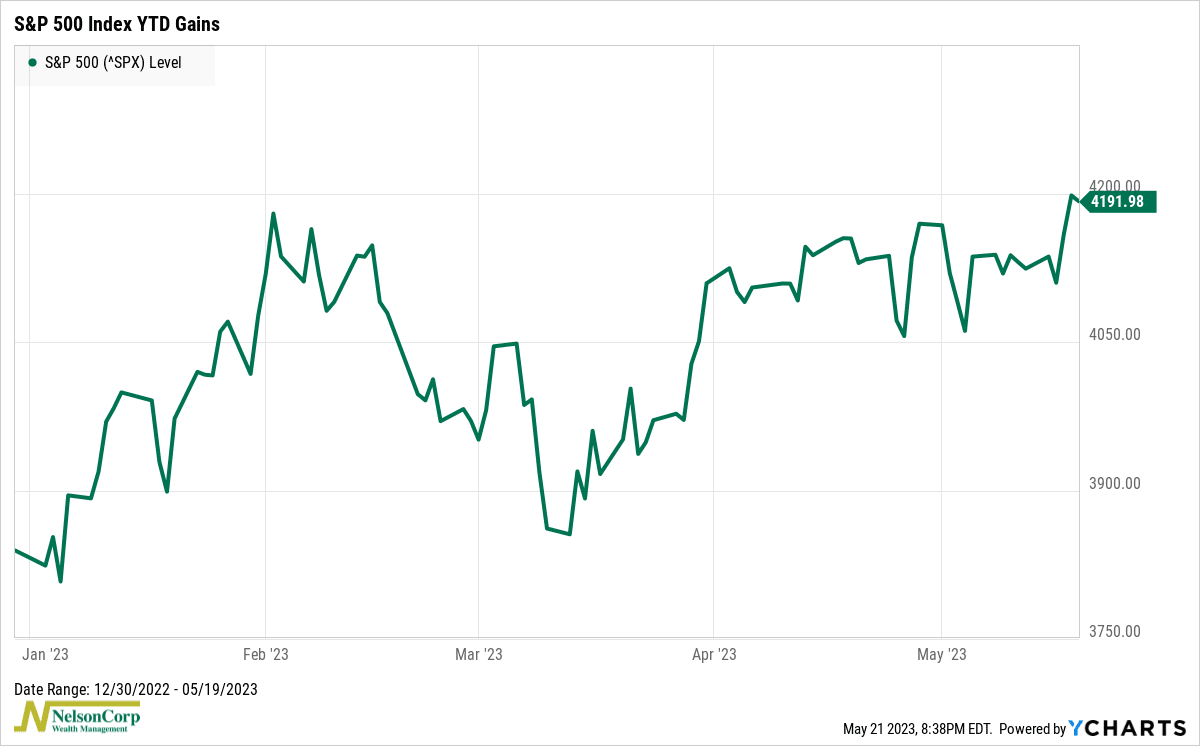
The three major U.S. stock indices ended the week on a positive note, with both the Nasdaq and S&P 500 achieving their highest weekly close since August 2022. The Dow experienced a modest increase of 0.38%, while the S&P 500 saw a rise of 1.65% and the Nasdaq surged by an impressive 3.04%.
In terms of stock performance, growth shares took the lead with a gain of 2.5%, while value stocks experienced a rise of approximately 0.9%. Additionally, small-cap stocks demonstrated a solid increase of 2.25%.
Foreign stocks registered moderate gains throughout the week, with developed country stocks rising by 0.25% and emerging markets growing 0.44%.
Over in the bond market, the 10-year Treasury rate increased to 3.68%, resulting in losses of about 1.4% for intermediate-term Treasuries and 3.07% for long-term Treasuries. Investment-grade corporate bonds experienced a decline of 1.47%, while high-yield bonds dropped by 0.42%.
Commodities declined approximately 0.11% during the week, primarily influenced by a 1.9% decrease in gold and a notable 5.42% decline in corn. However, oil managed to rise by approximately 2.95%. Additionally, the U.S. dollar strengthened by 0.6%.
KEY CONSIDERATIONS
Yearly Momentum – Last week, I pointed out some reasons why one might be cautious towards equities in the short term. And while those developments are still valid concerns, this week, I want to point out a few reasons why one could be a little more optimistic in the long term.
For starters, the S&P 500 stock index rose to a year-to-date high last week, its highest weekly close since August 2022. This is an encouraging sign that the index might be able to break out of the sideways trading range it’s been stuck in for a while now.

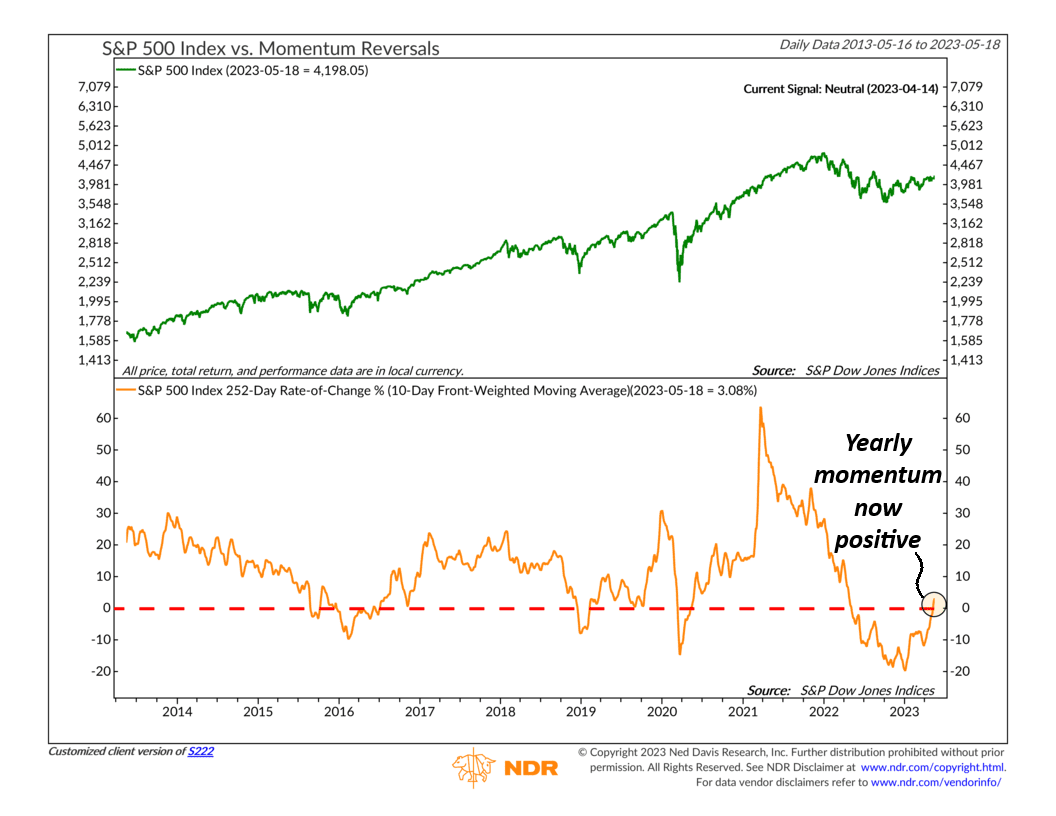
But another big thing happened recently that likely has a lot of bulls grinning. It has to do with the 1-year (252-day) rate of change of the S&P 500—or what I call “yearly momentum.”
As the chart below shows, the S&P 500 was negative on a year-over-year basis for a whole year. But recently, it turned positive.

Looking at past instances when the S&P 500 experienced a negative year-over-year growth rate for longer than a year, it is worth noting that each time it subsequently turned positive, it never declined a year later. In fact, the S&P 500 has been higher on all eight occasions, yielding an impressive average return of 15%.
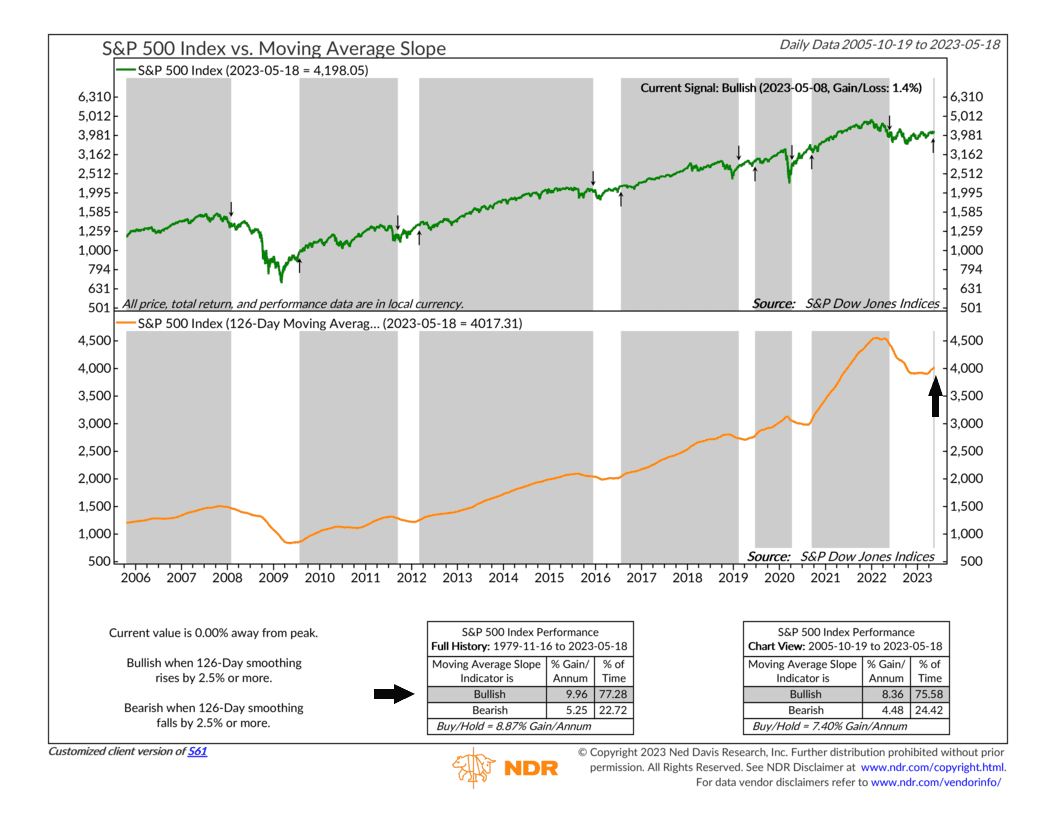
This is an encouraging sign for the long-term health of the stock market, especially when we see it occurring alongside a bullish signal from this next chart, showing the 126-day (or half-year) trend of the S&P 500.

After being in a downtrend for a year, this metric is finally starting to rise again. Historically, such a reversal has indicated a renewed uptrend and above-average gains in the stock market.
So, the bottom line is that while it is still plausible for conditions to deteriorate at some point this year, there are encouraging bullish trends beginning to take shape in the longer term. We must await confirmation from the weight of the evidence, but it is a development worth monitoring as we move forward.
This is intended for informational purposes only and should not be used as the primary basis for an investment decision. Consult an advisor for your personal situation.
Indices mentioned are unmanaged, do not incur fees, and cannot be invested into directly.
Past performance does not guarantee future results.
The post Yearly Momentum first appeared on NelsonCorp.com.