OVERVIEW
The major U.S. stock indices ended the week in mixed territory.
The S&P 500 gained 0.16 percent, but the Dow and the Nasdaq edged lower by 0.13 and 0.10 percent, respectively.
The largest weekly gains came from small-cap stocks, which rose by 0.87 percent.
The MSCI EAFE index, which tracks developed country stocks, rose a respectable 0.36 percent. However, this lagged the weekly performance of the MSCI Emerging Markets index, which rose 0.86 percent.
After diving to start the week, the yield on U.S. 10-year Treasury bonds rose and, following the strong Friday jobs report, ended the week around 1.84 percent.
Most bonds suffered as a result, except for high yield bonds, which rose about 0.35 percent.
The U.S. dollar dropped about half a percent, which helped boost commodity returns by nearly 1.5 percent for the week.
KEY CONSIDERATIONS
Vol-a-what? – The word “volatile” comes from the Latin volatilis, which means “fleeting, transitory,” or “to fly.”
The stock market is volatile, meaning its returns can and do fluctuate erratically over time. Anybody who has ever put their savings at risk in the stock market is intimately (and sometimes painfully) aware of that fact.
The good news, however, is that if we analyze it properly, we can sometimes use volatility to our advantage.
For instance, we can look at something called “implied volatility” to measure how much fear is present in the stock market. We do this by observing the CBOE Volatility Index, or VIX, which is a popular measure of the stock market’s expectation of volatility based on the price of S&P 500 index options.
The concept is as follows. During times of distress, investors pile into put options, which benefit if the stock market declines. The prices of both put and call options rise as a result (due to arbitrage), which ultimately raises the level of the VIX index. Because of this, the VIX is sometimes known as the “Fear Index,” and it tends to peak during significant price declines.
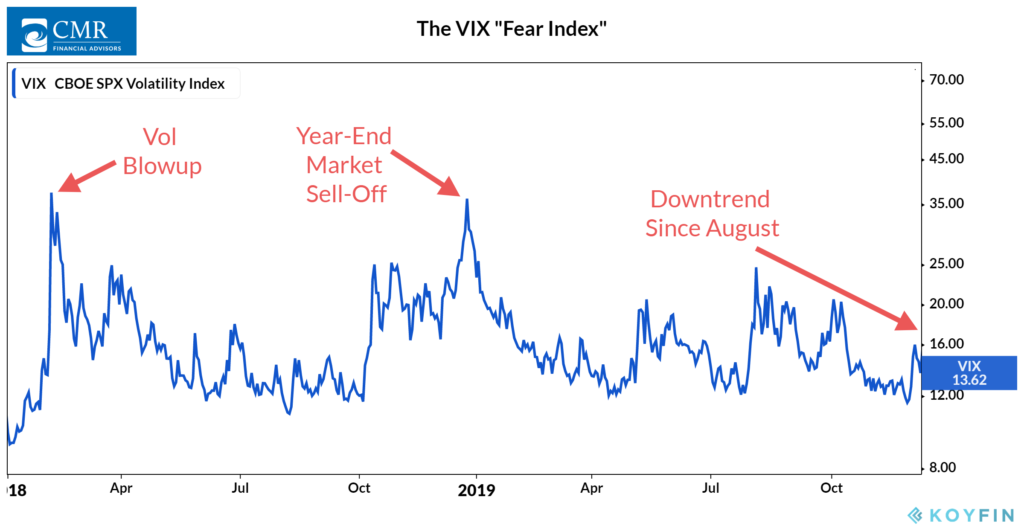
For example, the VIX index shot up during the “Vol blowup” that occurred in February 2018. It peaked again during the market sell-off at the end of last year.

Compared to these events, the recent pick up in volatility remains subdued. In fact, the VIX has been in a downtrend since August, which has perhaps contributed to the recent run-up in stock prices.
There are other ways to analyze the VIX other than just looking at its level.
In general, high but falling volatility is the most bullish time for stock prices. Indeed, the VIX had recently climbed into an upper zone relative to its 20-day average.
Last week, however, it fell back below this zone. Historically, stocks do well during the next month or so after something like this occurs.
However, not all the signals that come from analyzing the VIX are bullish.
The VIX is often used as a sentiment measure since it represents what traders are willing to pay for S&P 500 options based on their expectations for future volatility.
If we see a deviation from its trend after being at a low level, such as a rise in its average 12-day reading relative to its average 68-day reading, it reflects a reversal from a period of complacency/optimism. This tends to be a sign of more volatility to come, and potentially a downturn.
All things considered, however, the picture is mostly a positive one based on the readings we are currently seeing from the VIX index.
This is intended for informational purposes only and should not be used as the primary basis for an investment decision. Consult an advisor for your personal situation.
Indices mentioned are unmanaged, do not incur fees, and cannot be invested into directly.
Past performance does not guarantee future results.
The post Vol-a-what? first appeared on NelsonCorp.com.