OVERVIEW
The U.S. stock market was mixed last week. The Dow dropped 1.38%, but tech stocks helped push the S&P 500 higher by 0.32% and the Nasdaq by 1.24%. The Russell 3000 Growth index posted a weekly gain of 1.5%, whereas its value counterpart fell 1.89%.
In the international space, performance was more one-sided. The MSCI EAFE index of developed country stocks fell 0.82%, and the MSCI Emerging Markets index fell 1.26%.
On the bond front, performance was mixed as well. A drop in the 10-year Treasury yield to 1.55% helped boost long-term Treasuries by about 0.92%. However, investment-grade corporate bonds fell 0.03%, and high-yield (junk) bonds fell 0.28%. Municipal bonds gained 0.12%, and TIPS declined 0.05%.
The U.S. dollar strengthened nearly 1% last week. This weighed down commodities, which fell 0.47% overall. Specifically, oil fell 3.93%, corn dropped 1.37%, and gold declined 0.88%. Real estate also registered a decline of 0.23%.
KEY CONSIDERATIONS
Consumer Discretion – There are a couple of charts I’ve had my eye on lately. One is related to global economic growth, and the other has to do with global stock market performance. The interesting thing is that both have been telling somewhat similar stories lately.
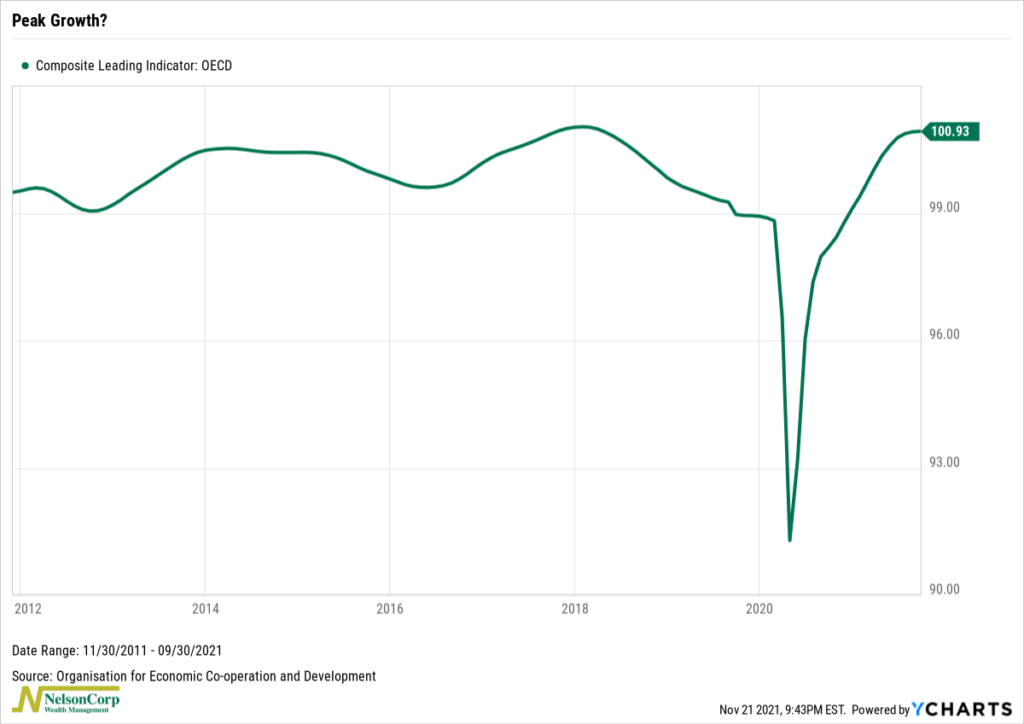
First, let’s look at the economic chart. Below is the OECD Composite Leading Indicator (CLI). This indicator is designed to provide early signals of turning points in the business cycles of 29 member countries worldwide. It basically paints a broad picture of economic activity based on a large amount of recent forward-looking data.

The latest monthly reading was 100.93. This is significant because the series is fixed at 100 (representing the long-term average), so a CLI reading above 100 means global economic growth (GDP) levels are expected to be above trend six to nine months from now.
More so, the CLI is up 2.79% from a year ago and 0.01% from last month. This suggests that not only is the global GDP level expected to be above the long-term trend in six to nine months, but also that the GDP trend-gap is expected to widen. Stated differently, the pace of growth—which is expected to be above trend—is likely to accelerate.
With that said, however, looking at the chart of the CLI, it does appear that the post-pandemic rebound in global economic growth may soon be reaching a peak in the OECD area. The month-to-month changes have been getting smaller every month. It will be worth watching how the next few months shake out. If the month-to-month change in the CLI turns negative, it would suggest a slowing in the pace of expected GDP growth (although the GDP level would still be above trend).
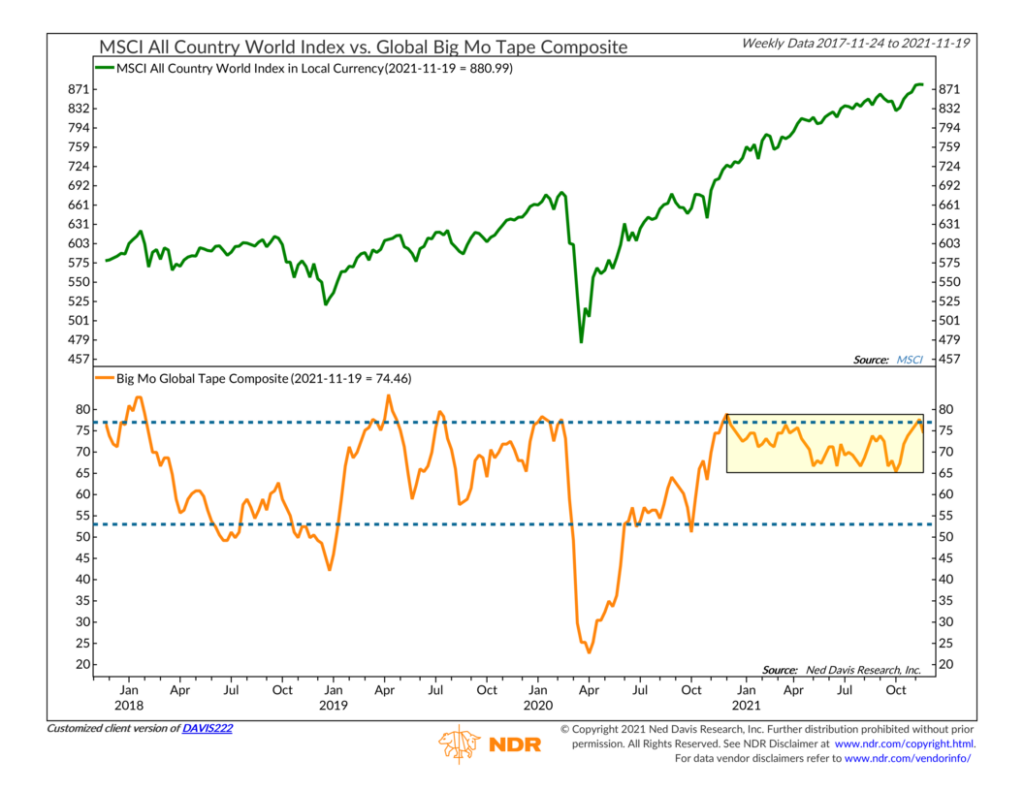
Ok, so now to the stock chart. Here we have an indicator that uses a composite of price-based trend and momentum indicators from the countries in the MSCI All Country World Stock Index. When combined into one reading (represented by the orange line), it helps us measure the stock price momentum in the stock markets of the underlying countries that make up the MSCI ACWI.

Here we have a similar story of accelerating global stock price momentum coming out of the pandemic. The indicator reached a peak near the end of 2020, much earlier than the OECD CLI composite, but it has stayed near the upper end of its range for most of this year. Globally, stocks have done well during this same period, as evidenced by the upward march of the MSCI ACWI (green line—top part of the chart).
However, the key point is that, despite a recent surge this past month, this global momentum indicator has failed to get above the upper dashed line (the most bullish environment historically) for more than just a brief moment.
In other words, global stock price momentum is good, but it’s not great. Or at least it could be better. And if global economic growth is peaking or expected to peak in the near future, then this all points to a more challenging path forward for global stock market returns.
Of course, this doesn’t by any means suggest that stock prices are going to fall; it just means they may have to prove themselves in a future economic environment where growth is slowing down from the abnormally high levels we’ve been used to this past year.
This is intended for informational purposes only and should not be used as the primary basis for an investment decision. Consult an advisor for your personal situation.
Indices mentioned are unmanaged, do not incur fees, and cannot be invested into directly.
Past performance does not guarantee future results.
The post Thinking Global first appeared on NelsonCorp.com.