OVERVIEW
It was another strong week for U.S. stocks. The tech-heavy Nasdaq surged 3.24%, followed by the S&P 500, which gained nearly 1.6%, while the industrials-heavy Dow shed a little over 0.5%.
Technology was the top-performing sector, with AI and semiconductors remaining strong tailwinds for markets this week. Sure enough, growth stocks registered gains of over 3%, while value and small-caps stocks got left behind, falling a little over 1% each.
Across the Atlantic, European equities faced a rocky week and finished broadly in the red. Overall, developed country stocks fell more than 2.5%, whereas emerging markets managed to gain about 0.35%. The U.S. dollar strengthened about 0.75%.
Up next in the bond market, we saw elevated volatility in U.S. Treasuries during a busy week, but overall, the Bloomberg Aggregate Bond Index rose about 1.3%. Long-term Treasuries increased around 3.5%, and short-duration Treasuries rose about 0.11%.
Finally, we saw commodities mainly trade higher last week, with the Bloomberg Commodity Index rising about 0.7%. Oil led the way, up over 4%, while gold rose 1.14% and corn gained a little under 1%. Real estate did well, rising about 1.25%.
KEY CONSIDERATIONS
The Two Buoys – It’s kind of strange. Last Thursday, the stock market reached another all-time high, and the S&P 500 Index is experiencing its best start to an election year in nearly a century.
And yet, when we look closely at the weight of the evidence, only two factors are clearly bullish: the trend and inflation.
Now, when I mention “the trend,” I’m simply talking about the general direction of stock prices. Trend is one of six components that make up what we call the market’s “price movement.” There are actually two other components leaning bullish in this category, but to keep things simple, we’ll just focus on the trend.
So, what does the trend look like now? Well, here’s one indicator that sums it up nicely. It uses the S&P 500’s 63-day (3-month) average price and divides it by its 252-day (1-year) average price. This is shown as the orange line on the chart below.
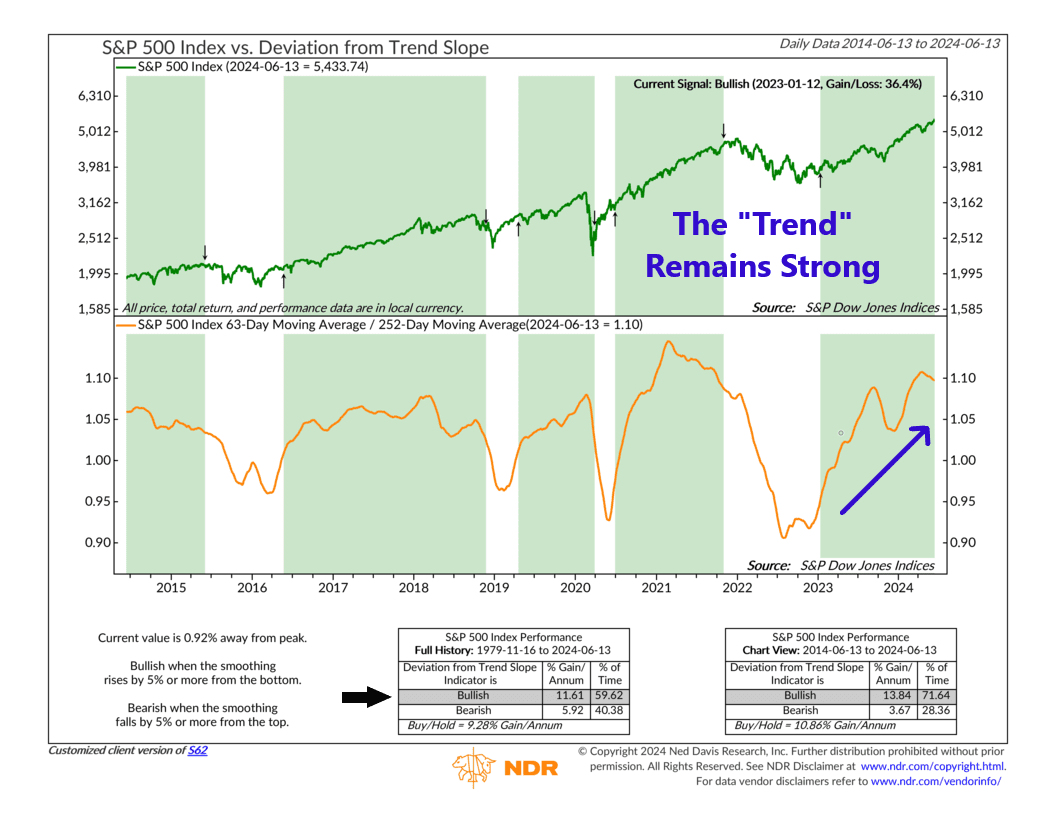
When this line—representing the market’s trend—rises by 5% or more from a low, it signals a bullish uptrend. When it falls by 5% or more from a high, it signals a bearish downtrend.
As you can see, it generated a bullish signal at the beginning of 2023 and has stayed bullish ever since. It had a hiccup last fall and is again experiencing some weakness. But overall, it remains positive.
The other component is inflation. Surprisingly, it is the only positive macroeconomic component in our model.
One way we measure inflation is by using the chart below, which compares the Consumer Price Index’s current annual rate to its 5-year average rate.
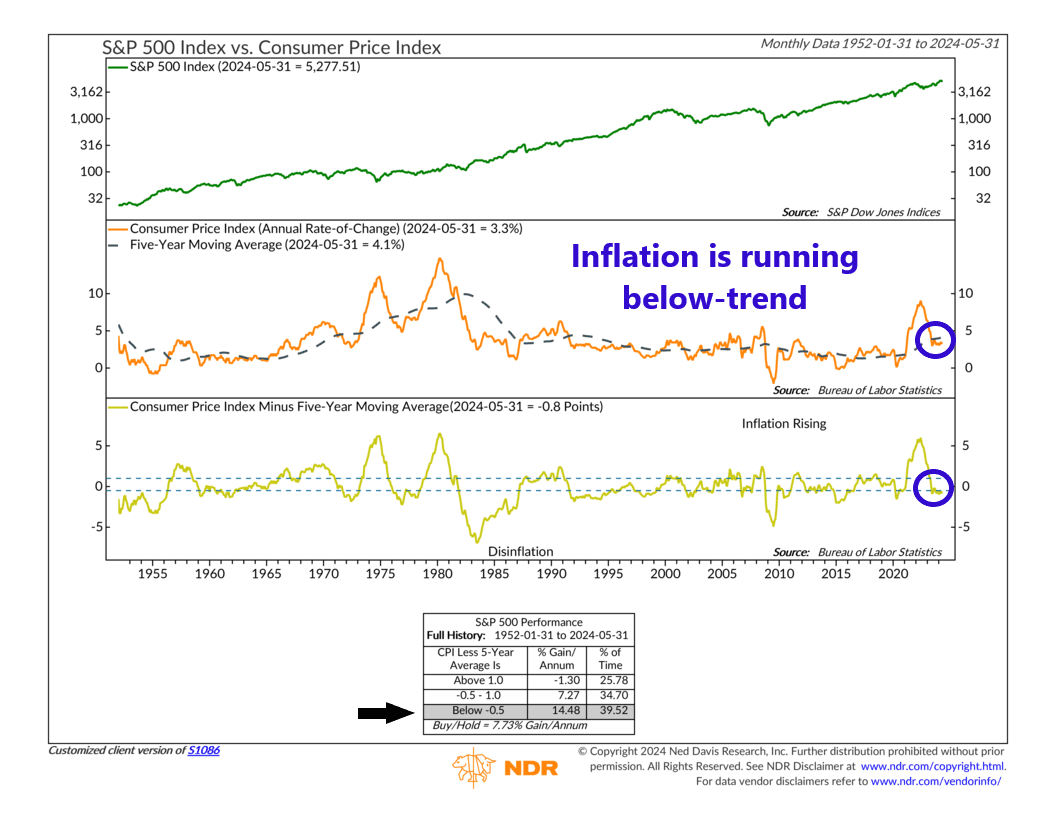
As you can see, inflation is currently running at an annualized pace of 3.3%, which is about 0.8 percentage point below its 5-year average of 4.1%. Historically, this has been a bullish sign for stock returns.
So, the bottom line is that the current bullish outlook for stocks primarily hinges on a sustained positive price trend and favorable inflation rates. These are the main buoys guiding the market’s strength, and any significant changes in these factors could alter the market’s direction.
This is intended for informational purposes only and should not be used as the primary basis for an investment decision. Consult an advisor for your personal situation.
Indices mentioned are unmanaged, do not incur fees, and cannot be invested into directly.
Past performance does not guarantee future results.
The S&P 500 Index, or Standard & Poor’s 500 Index, is a market-capitalization-weighted index of 500 leading publicly traded companies in the U.S.
The post The Two Buoys first appeared on NelsonCorp.com.