OVERVIEW
The U.S. stock market surged higher last week, notching its best week of the year and snapping a multi-week losing streak. A handful of earnings results and economic data helped boost investor sentiment, and all three major stock indexes jumped at least 6% for the week. The S&P 500 rose 6.58%, the Dow gained 6.24%, and the Nasdaq rose 6.84%.
Foreign stock markets did less well but still notched gains for the week. Developed market stocks gained 3.38%, and emerging markets rose 0.76%.
Interest rates continued to cool off over in the bond market, as the yield on the U.S. 10-year Treasury dropped to 2.75%, down from 2.85% the week prior. Treasuries saw moderate price gains across the board as a result.
Corporate bonds had a strong week, with investment-grade issues gaining 1.66% and high-yield (junk quality) bonds surging 3.34%. Municipal bonds gained around 2.5%, and TIPS rose 1%.
Outside of U.S. equities, real estate was the best performing asset class last week, gaining around 5.77%. Commodities also did well, rising about 2.55% broadly. This was led by a 4.67% gain in oil. Gold rose 0.48%, but corn dropped about 0.19%. And finally, the U.S. dollar weakened by 1.38% to end the week.
KEY CONSIDERATIONS
Slowing Down – Is the U.S. economy headed for a recession?
That’s the big question on a lot of people’s minds right now.
It’s not always easy to tell in real-time when a recession has happened. Only after the fact does the NBER Business Cycle Dating Committee determine when an official recession has occurred.
But we do have some timely indicators at our disposal that allow us to peel back the complicated layers of the economy and glimpse where it’s headed.
The Conference Board’s Leading Economic Index (LEI) is one such indicator. The index is comprised of 10 economic indicators whose changes tend to precede changes in the overall economy. These indicators form a composite that does a good job of indicating where the U.S. economy is headed in the next six months or so.
So, what’s the LEI telling us currently?
Well, last month, it decreased by 0.3%. This was primarily due to weak consumer expectations and a drop in residential building permits. Overall, the index has been essentially flat in recent months. According to The Conference Board, this would be in line with a moderate growth outlook in the near term.
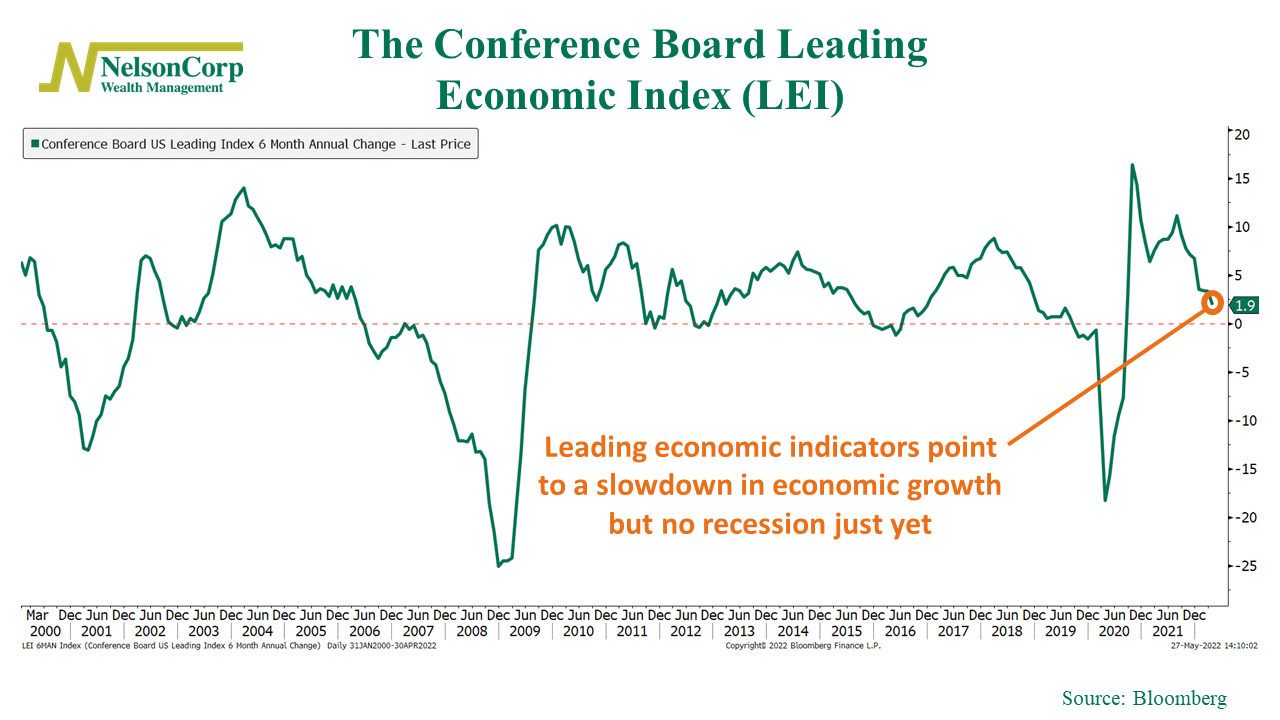
To get a longer-term perspective of the series, I show the all-important 6-month annual change of the LEI in the chart below.

Again, the story is the same. It’s slowed dramatically relative to a year ago.
But, as you can see, it hasn’t yet plumbed the depths reached in previous recessions.
So, the story from the LEI overall is that we are likely reaching an inflection point for the U.S. economy, with slower growth to be expected.
However, we will probably need to see the LEI fall further for a recession to occur officially.
As for the stock market, the S&P 500 Index is one of the ten components that make up the LEI. The stock market is a forward-looking machine that anticipates where the economy and corporate profits are headed, so it makes sense that it would be a component of a leading economic index. And stocks have been trending lower in recent months, which also explains some of the downturns in the LEI.
However, I would note that the stock selloff has been less about lower expectations for corporate profits (i.e., the economy) and more about investors repricing what they’re willing to pay for those earnings.
Inflation is high, and the Fed is pushing interest rates higher to combat inflation. So, when rates go up, the present value of a company’s future discounted cash flows goes down, particularly if those cash flows are expected to come further out in the future. If this repricing of risk in the face of an uncertain interest rate environment results in slower growth for the economy, we could go into recession.
But it’s not clear that’s the message stocks are sending now.
And the implication of the LEI is similar. The Conference Board still projects the U.S. economy to grow by 2.3% this year.
That’s the sort of growth environment we’ve become accustomed to over the past decade. So, corporate profits should be able to do fine here.
The question we are left with, then, is how much will investors be willing to pay for those profits, particularly if the interest rate, fiscal, and monetary policy environments are less accommodative than they have been in recent history?
This is intended for informational purposes only and should not be used as the primary basis for an investment decision. Consult an advisor for your personal situation.
Indices mentioned are unmanaged, do not incur fees, and cannot be invested into directly.
Past performance does not guarantee future results.
The post Slowing Down first appeared on NelsonCorp.com.