OVERVIEW
The U.S. stock market had a volatile week as the VIX (the “Fear Gauge”) jumped above 20 on a few trading sessions.
The S&P 500 fell 0.59%, the Dow dropped 1.11%, and the Nasdaq decreased 0.73%.
Growth stocks fell 0.4%, which outperformed the 1.31% decline for value stocks. Large-cap stocks held up relatively well, falling just 0.39%, compared to the 2.14% sell-off in small-cap stocks.
Foreign stocks did even worse. Developed country stocks fell 3.02%, and emerging market stocks plummeted 4.69%.
Bonds, on the other hand, did well as investors piled into the safety of U.S. Treasuries. Intermediate-term Treasuries rose 0.33%, and long-term Treasuries gained 1.44%. Investment-grade corporate bonds held up well, gaining 0.19%. However, high-yield (junk) bonds fell 0.06%, municipal bonds dropped 0.08%, and inflation-protected Treasuries (TIPS) declined 0.43%.
Commodities also had a rough week, falling 4.21% overall, as the U.S. dollar strengthened around 1.05%. The main driver of this was the 8.43% fall in oil prices. Corn also fell 6.28%. Gold, however, rose 0.33%. Real estate, on the other hand, fell 0.16%.
KEY CONSIDERATIONS
Searching for Inflation – It’s been a wild year for bond investors. By mid-March, stocks were already up about 4%, while intermediate-term Treasuries had fallen nearly 6% and long-term Treasuries had tumbled roughly 15%.
Since then, however, bonds have done a lot better. Intermediate-term Treasuries have rallied about 4%. And, perhaps surprisingly, long-term Treasuries have kept up with stock returns, gaining roughly 13% since the mid-March bottom.
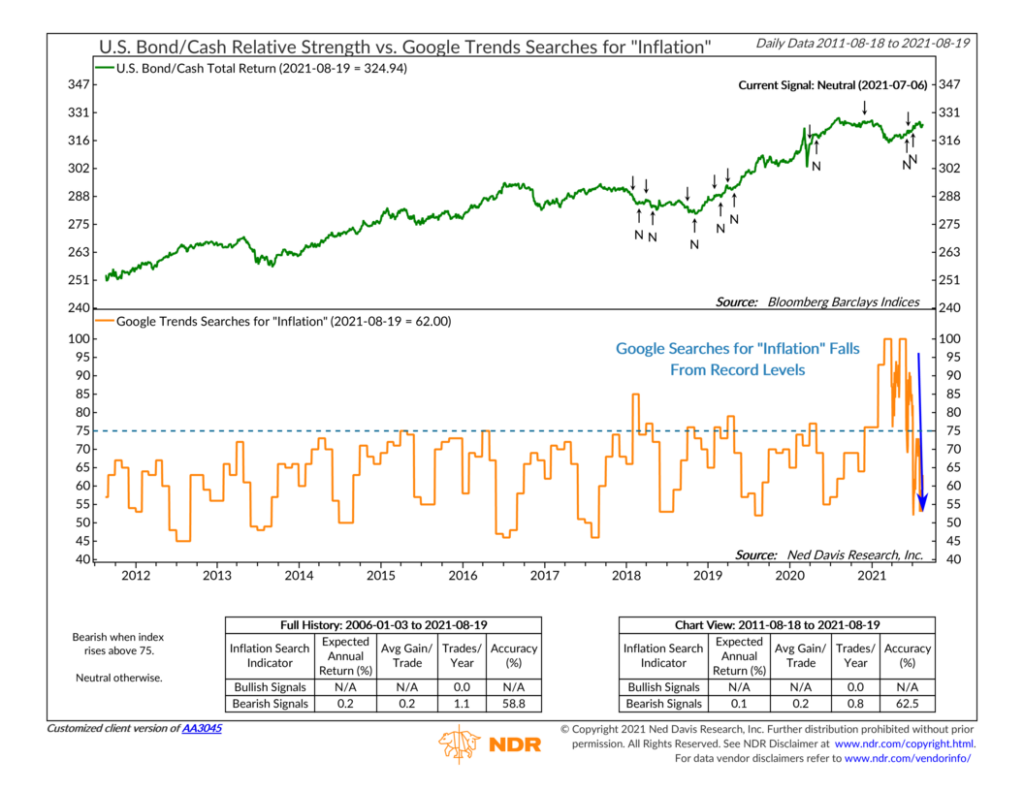
So, what’s going on here? One explanation is that inflation fears have subsided in recent months. The bottom clip in the chart below shows daily Google Trends searches for inflation. They started rising rapidly last year, and the index shot above 75 at the end of the year. A rise above 75 is the threshold at which conditions have historically been poor for bond returns relative to cash. (The U.S. bond/cash ratio is shown in the top clip of the chart.)

By March and April, Google searches for inflation had peaked at record high levels. But then they started falling. This decline in interest surrounding inflation coincided with the aforementioned rally in bond prices.
This makes some sense. Inflation is bad for bondholders, who receive fixed income payments that lose purchasing power over time if inflation comes in hotter than expected. If more and more people search for inflation on the internet, it’s likely because inflation is something they are worried about.
But here’s the thing about inflation: it’s notoriously hard to understand what causes it let alone measure and predict it. If it’s just a temporary spike off a low base, like what many economists (including the Fed) have communicated, then inflation doesn’t actually become entrenched in people’s expectations. It’s this entrenched inflation that is a real problem for bondholders down the road.
With Google Trends searches for inflation back down to lower levels, it appears the narrative has shifted somewhat relative to where it was at the beginning of the year. If people are no longer that interested in inflation, then it will be harder for inflation to stay high in the long term. That’s because it’s more challenging to sustain a high rate of inflation if workers don’t demand wage increases to compensate for expected future inflation.
So, the bottom line is that, holding all else equal, bonds tend to benefit when inflation expectations stay anchored and don’t get out of control. The indicator above suggests that this is the case. Therefore, perhaps this goes a long way towards explaining why bonds have rallied of late.
This is intended for informational purposes only and should not be used as the primary basis for an investment decision. Consult an advisor for your personal situation.
Indices mentioned are unmanaged, do not incur fees, and cannot be invested into directly.
Past performance does not guarantee future results.
The post Searching for Inflation first appeared on NelsonCorp.com.