OVERVIEW
The U.S. stock market stumbled last week as volatility came rushing back to Wall Street. The S&P 500 Index slipped 3.4%, the Dow Jones Industrial Average fell 2.8%, and the Nasdaq Composite dropped 4%.
Foreign stocks, however, were mixed. The MSCI EAFE Index of developed country stocks decreased 0.2%, whereas the MSCI EM Index of emerging country stocks rose 0.5%.
Bond yields picked up, with the 10-year Treasury rate rising to 3.6% from 3.5% the week before. Intermediate- and long-term Treasuries fell 0.4% and 0.6%, respectively. Investment-grade corporate bonds dropped 0.3%, and high-yield (junk) bonds decreased 0.2%.
There really was nowhere to hide, with real assets mostly in the red as well. Real estate fell 2%, and commodities dropped 2.4% broadly. Oil was the biggest loser of the week, down 10%. Gold, however, notched a slight gain of 6 basis points. And finally, the U.S. dollar strengthened about 0.5%.
KEY CONSIDERATIONS
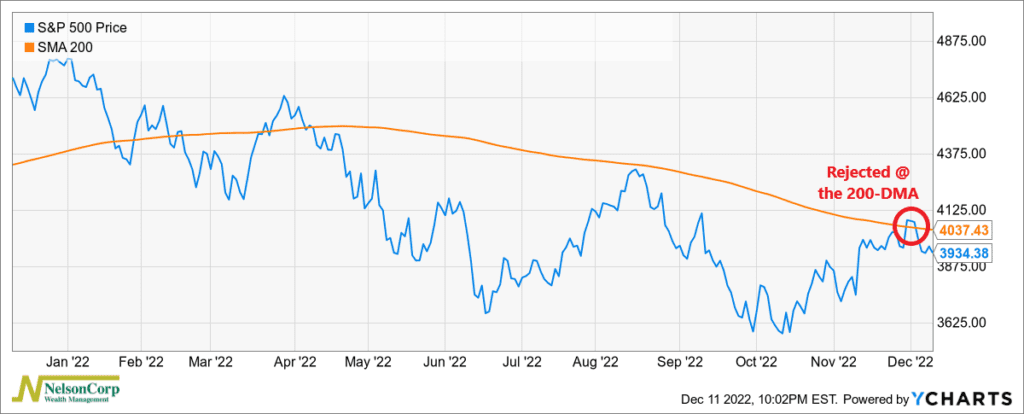
Rejected – The S&P 500 stock market index was in for a rude awakening last week as it attempted to permanently break through its 200-day moving average.
Investors had been eagerly anticipating a breakout, but hopes were quickly dashed as the benchmark index was resolutely rejected at the key technical level, shown below.

Now, that’s not to say that the current rally is over. But it’s hard to argue against the fact that the 200-day moving average has proven to be a formidable barrier this year.
But why did the stock market seemingly lose steam here?
It might have something to do with an interesting relationship between the VIX Index—a measure of stock market volatility—and the S&P 500 Index.
Historically, these two are often inversely correlated, meaning that when one goes up, the other tends to go down. This makes sense since the VIX is a good measure of investor sentiment, and investor sentiment tends to be wrong at the extremes.
Specifically, we’ve found that a low and rising VIX is bad for stock returns, whereas a high and falling VIX is good for stock returns. This relationship isn’t always cut and dry, but it generally makes for a good rule of thumb.
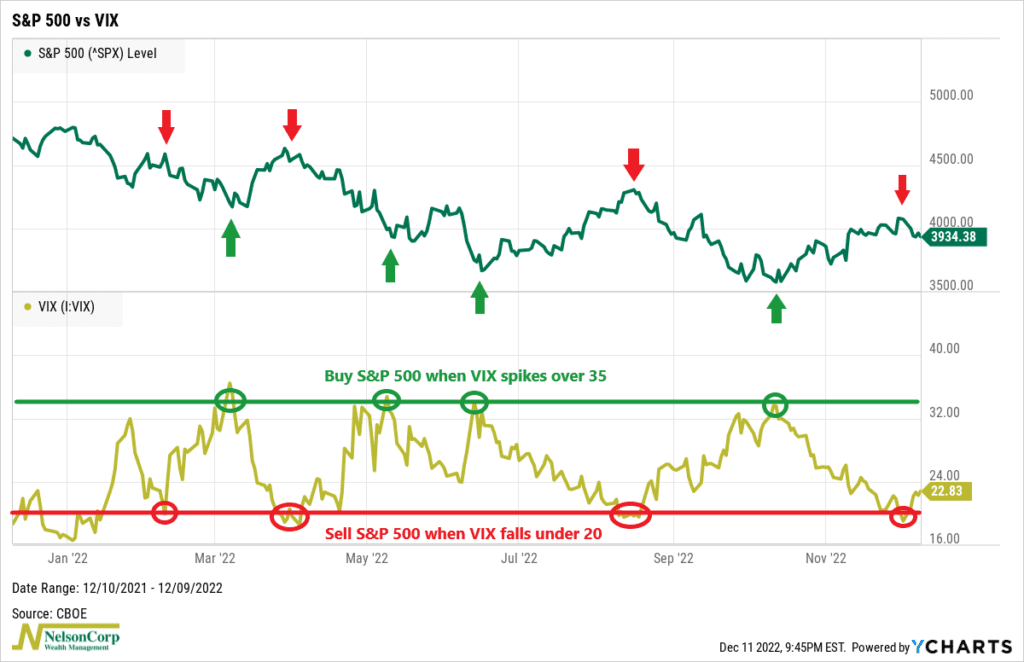
As the chart below shows, this rule of thumb has been especially accurate this year. The rules of the system are simple: buy the S&P 500 when the VIX surges above a level of roughly 35—indicating a relative amount of fear—and sell the S&P 500 when the VIX dips below 20, indicating relative complacency among investors.

The VIX recently dropped below 20 when the S&P 500 touched its 200-day moving average. And now it’s rising from a low level. The double whammy of hitting a key technical resistance level alongside a low but rising VIX has acted as a headwind for stocks.
Looking ahead, the next potential “VIX buy” signal would come if we see the VIX spike back up near the 30-35 level. From there, however, it would make sense to look at a variety of factors and indicators—including key technical levels in the S&P 500—to determine whether a sustainable rally is underway.
This is intended for informational purposes only and should not be used as the primary basis for an investment decision. Consult an advisor for your personal situation.
Indices mentioned are unmanaged, do not incur fees, and cannot be invested into directly.
Past performance does not guarantee future results.
The post Rejected first appeared on NelsonCorp.com.
CMR Financial Advisor, Inc.
1003 Bishop Street, Suite 2620
Honolulu, Hawaii 96813
808-537-2912
Email Us