OVERVIEW
U.S. stocks fell last week as volatility reemerged on Wall Street. The VIX Index—a measure of investors’ expectations for market volatility—rose 25% for the week. The result was pretty large losses for the major U.S. stock indices. The S&P 500 fell 2.9%, the Dow declined 1.9%, and the tech-heavy Nasdaq plummeted 3.6%.
The U.S. dollar rose about 0.4% for the week as the value of the Japanese Yen weakened sharply against the dollar. As for foreign stock markets, they were down around 2% across the board.
Interest rates surged in the U.S. as the Fed signaled to investors that rates would likely stay higher for longer. The 10-year Treasury rate closed around 4.4% on Friday, the highest level in over a decade. The shorter-term 2-year Treasury rate also hit a high of about 5.2% at one point during the week. The end result was moderate losses across the board for bond prices.
Commodity prices didn’t hold up any better. Broadly, prices were down about 1.2%, with oil falling 0.8% and gold edging lower by roughly 0.03%. Corn, however, managed to gain about 0.2% for the week.
KEY CONSIDERATIONS
Playing Chicken – We all know the game of chicken. Two drivers drive at each other from opposite directions, and one must swerve—the chicken—or they both crash. The pressure builds. Nobody wants to be the chicken—but eventually, someone gives.
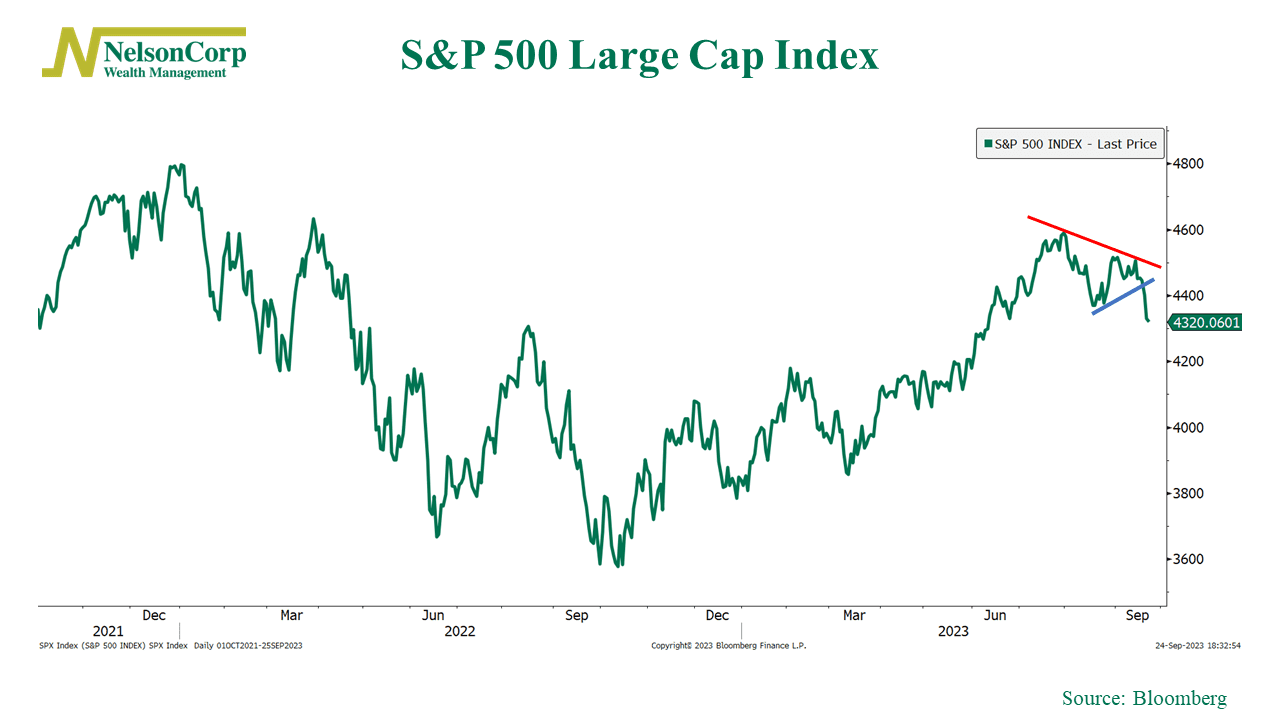
A similar game has been playing out in the stock market. For the past two months, the stock market bulls and bears have been battling it out, with neither side in control. Visually, it resulted in a pattern that looks like a triangle—or a narrowing pattern—on the S&P 500 Index. The bulls tried to push prices up, and the bears responded by pushing prices down. The pressure built up, as it tends to do with this type of pattern, and a resolution was inevitable.

As you can see on the chart above, the resolution ended up being to the downside. The S&P 500 closed below the lower bounds of the triangle pattern last week. In other words, the bulls were the cowards this time.
Now, usually, a narrowing pattern like this resolves in the direction of the underlying trend—which, in this case, would be to the upside. However, we got a catalyst for a downside move last week: the Federal Reserve meeting. Interest rates shot up as the market digested the takeaway from the meeting that rates would likely stay higher for longer—and stocks traded lower.
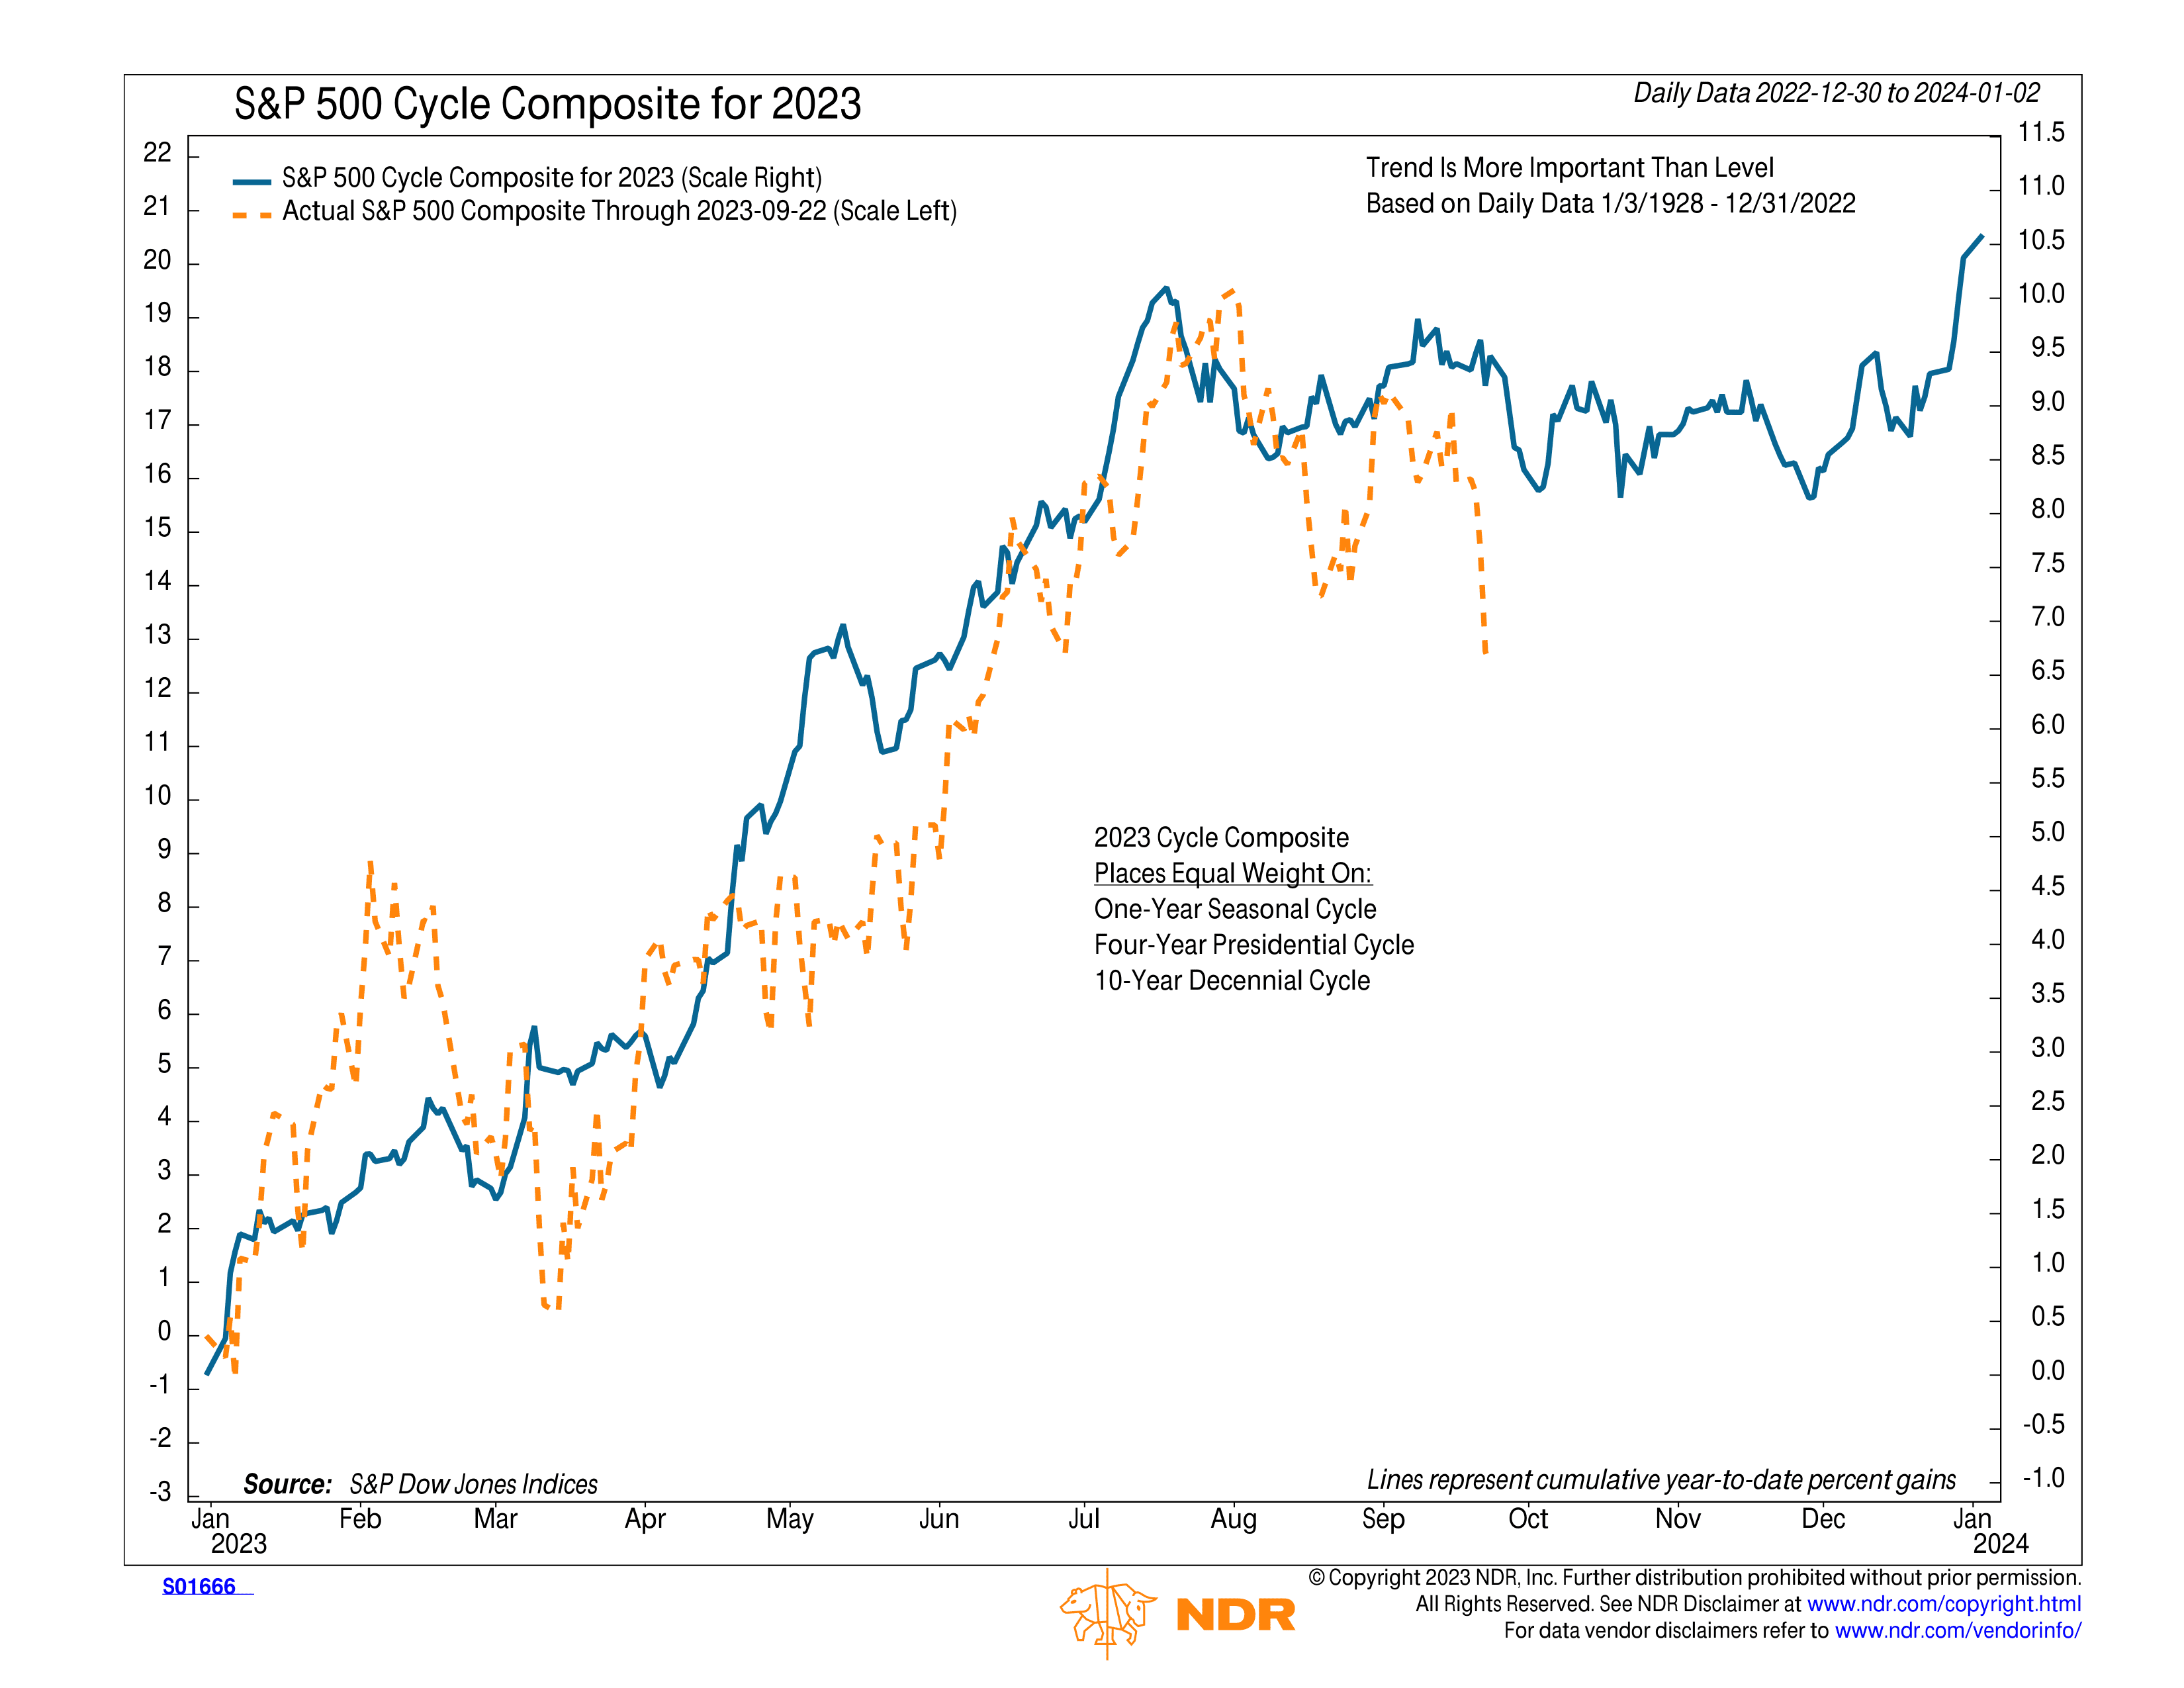
Fed meeting aside, however, it’s important to remember that we are also in the midst of what has historically been the worst two weeks of the year for the S&P 500. In fact, if we look at the S&P 500 Cycle Composite for 2023, which tracks the 1-year seasonal cycle, the 4-year presidential cycle, and the 10-year decennial cycle, the market is matching the seasonal tendencies quite closely.

According to the cycle composite, the market tends to experience a dip before October, and that’s exactly what we’re going through now. More so, the market is expected to trade sideways or slightly lower for another month or two before an eventual year-end rally.
So basically, the bears are in control at the moment, and if we consider seasonal effects, they may still have the upper hand for a little bit longer.
However, the underlying price action suggests that an upward trend is still intact for the S&P 500, and according to the cycle composite, a year-end rally could also be in the works.
For now, though, the weight of the evidence suggests a neutral stance towards stocks is likely warranted, at least until we get past some of the recent turbulence.
This is intended for informational purposes only and should not be used as the primary basis for an investment decision. Consult an advisor for your personal situation.
Indices mentioned are unmanaged, do not incur fees, and cannot be invested into directly.
Past performance does not guarantee future results.
The post Playing Chicken first appeared on NelsonCorp.com.