OVERVIEW
Last week was a good one for U.S. stocks. The S&P 500 went up by 1.66%, the Dow by 1.3%, and the Nasdaq by 1.4%. The big companies saw the most growth, with larger-cap stocks rising by 1.85%, while smaller-cap stocks fell by 0.8%.
International stocks also saw gains, with developed countries increasing by 1.4% and emerging markets by 1.2%.
Bond yields decreased slightly, with the 10-year Treasury rate falling to 4.25%, leading to a 0.25% increase in the overall bond market. Longer-term Treasuries performed even better, rising by 1.2%.
Real estate investments had a decent week, up about 0.5%. However, commodities took a hit, dropping by around 0.9%. Oil fell by 2%, corn by over 3%, but gold saw a 1.25% increase. Additionally, the U.S. dollar weakened by about 0.2%.
KEY CONSIDERATIONS
Not Too Shabby– It was another positive week of gains for our trusty ole S&P 500 Index last week. The market has now been up for 15 of the past 17 weeks.
How do returns over that period stack up to history?
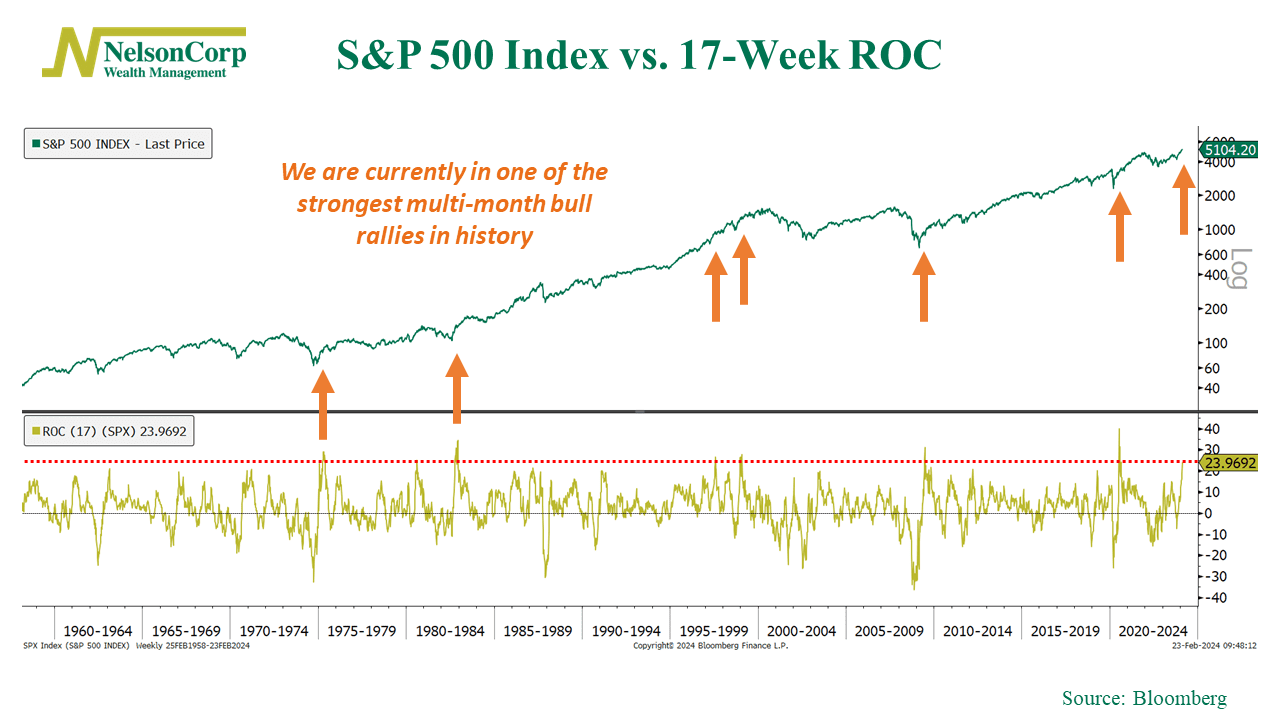
Quite well, actually. The chart below shows the S&P 500 Index (green line) along with its 17-week rate of change (gold line).

Over the past 17 weeks, the S&P 500 has gained about 24%. Only six other times in history has the S&P 500 Index rallied that strongly over a roughly 4-month period. And as the arrows on the chart show, each one of those periods was followed by strong gains.
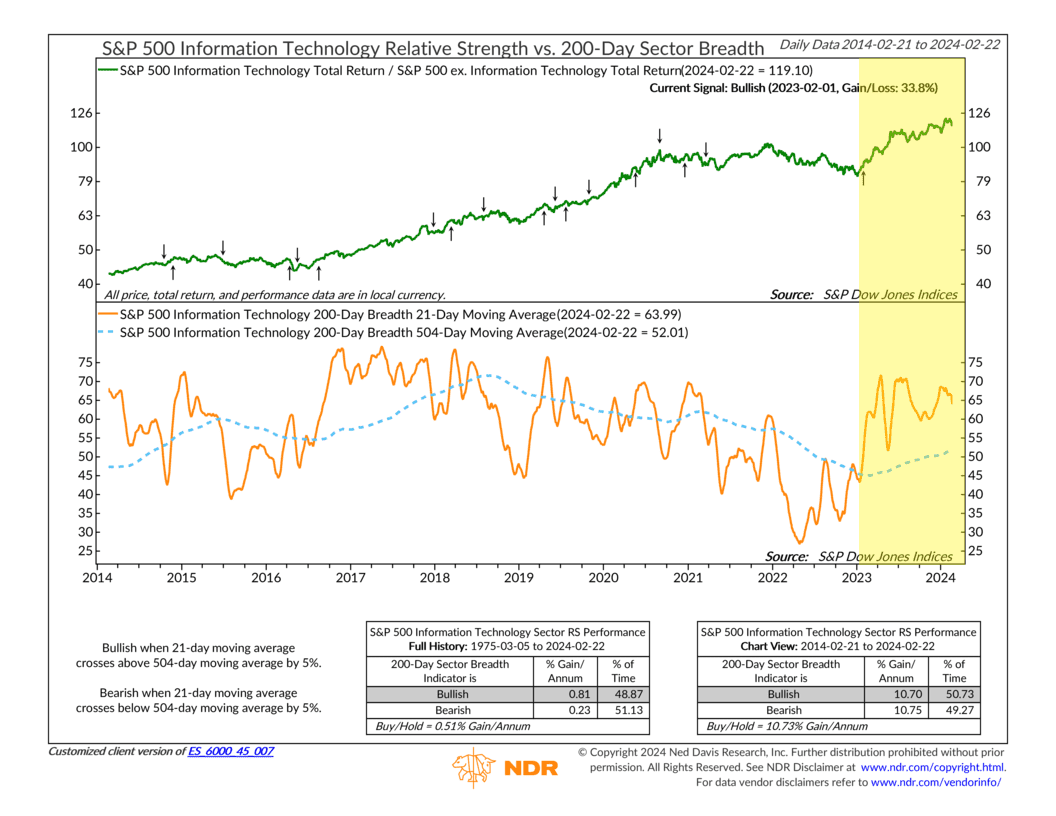
So, what’s driving the market higher? Well, the tech sector is one obvious candidate. As this next chart shows, the S&P 500’s Technology sector breadth has maintained the uptrend it established about a year ago (February 2023).

This is important because strong tech relative strength usually pushes the broader market higher, as some of the biggest and best-performing stocks in the S&P 500 Index come from the tech sector. In fact, over the past 30 years, just 5 of the big tech stocks are responsible for 10% of all global stock market gains!
But does all this great performance mean things have gotten out of hand? It’s possible. But we pointed out a few metrics on our blog this week that show why the market still appears reasonable.
Margin debt, for one, is climbing modestly from extremely oversold levels—and that is a historically strong place for the market to be.
Additionally, we showed in our Chart of the Week that the Nasdaq Composite’s rolling 1-year return—while quite strong—is nowhere near bubble territory at this time.
Putting it all together, the weight of the model evidence suggests a market with strong price movements and a solid economic backdrop, coupled with what we’d call a neutral or modestly optimistic environment from an investor behavior standpoint. In other words, not too shabby.
This is intended for informational purposes only and should not be used as the primary basis for an investment decision. Consult an advisor for your personal situation.
Indices mentioned are unmanaged, do not incur fees, and cannot be invested into directly.
Past performance does not guarantee future results.
The S&P 500 Index, or Standard & Poor’s 500 Index, is a market-capitalization-weighted index of 500 leading publicly traded companies in the U.S.
The NYSE Composite Index is a float-adjusted market-capitalization weighted index which includes all common stocks listed on the NYSE, including ADRs, REITs and tracking stocks and listings of foreign companies.
The post Not Too Shabby first appeared on NelsonCorp.com.