OVERVIEW
The major U.S. stock indices took a step back last week as interest rates continued their relentless drive upwards.
The S&P 500 Index fell 0.77%, the Dow Jones Industrial Average dropped 0.46%, and the Nasdaq Composite declined 0.79%.
Small-cap stocks fell around 3% for the week, whereas large-cap stocks only dropped about 0.85%.
Growth and value stocks, however, saw similar declines of around 1%.
Among foreign stocks, developed countries actually climbed about 0.55% for the week. Emerging markets, however, fell about 0.85%.
The U.S. 10-year Treasury yield marched higher and ended the week around 1.7%, up from the previous week’s high of 1.63%. Most bonds suffered price declines as a result (bond prices fall when yields rise).
Real estate fell about 1.23%, and commodities were essentially flat overall. Although oil dropped around 5.8%, corn and gold rose about 3.5% and 1.25%, respectively.
The U.S. dollar strengthened by about 0.36% against the world’s major currencies.
KEY CONSIDERATIONS
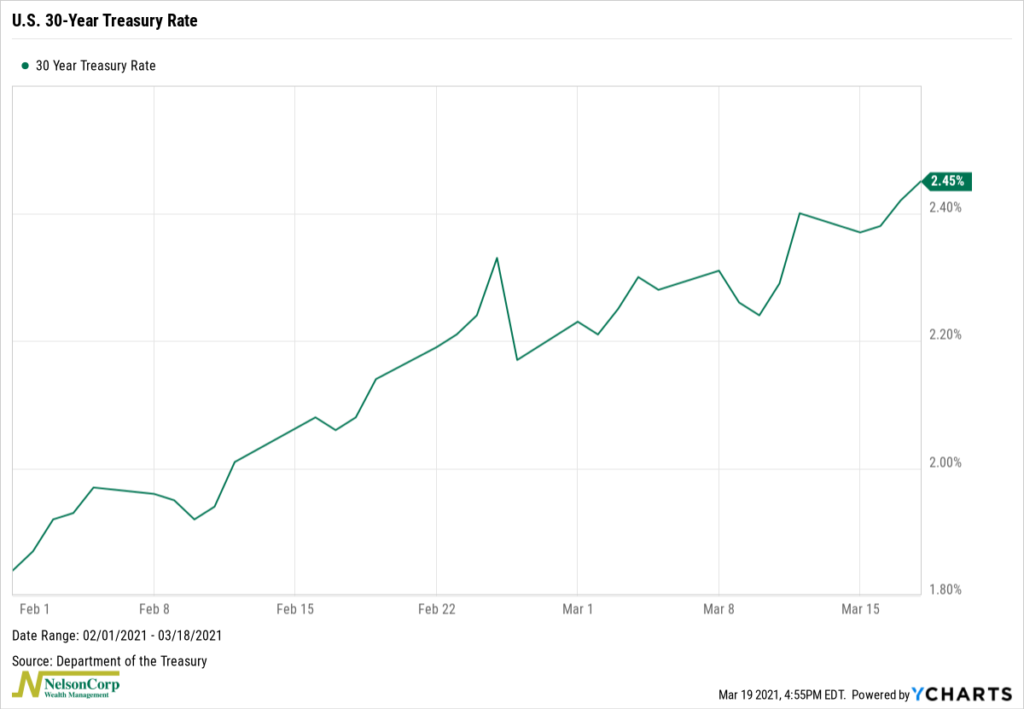
Not Fazed – Rising interest rates are all the talk on Wall Street right now. And for good reason. Since February 1st, the 30-year Treasury rate has gone from about 1.85% to 2.45%, a rise of 60 basis points.

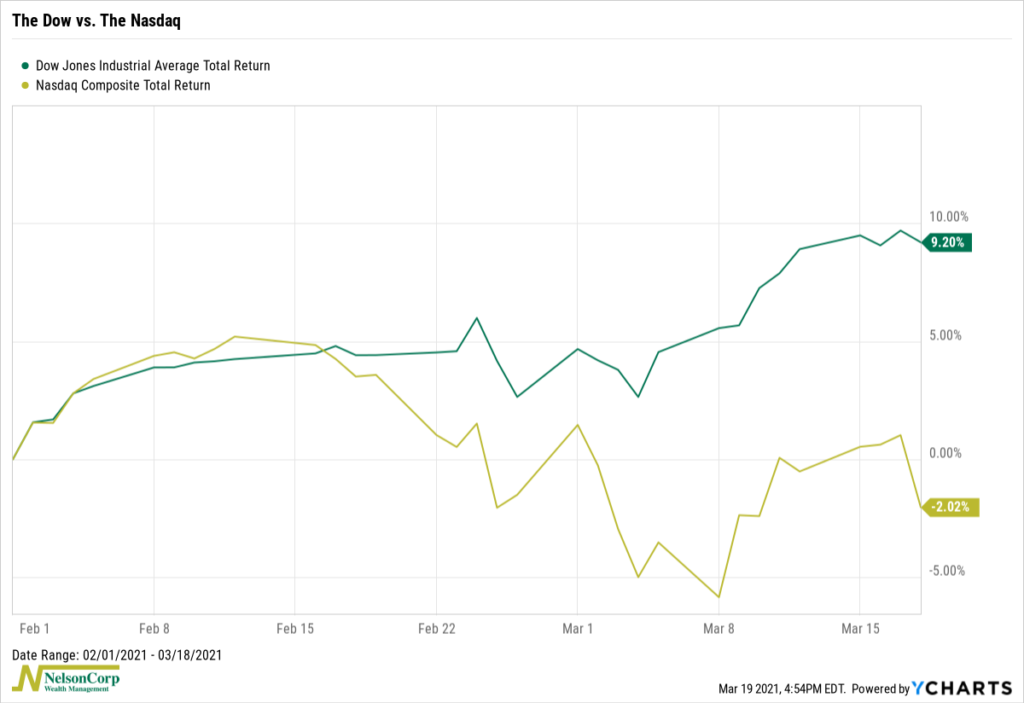
During that same time, we’ve seen the Dow Jones Industrial Average gain roughly 9% while the Nasdaq has fallen around 2%.

This makes sense. The Dow has a relatively high weighting to the more cyclical sectors like financials, industrials, and healthcare that tend to benefit when interest rates rise, and economic growth improves.
On the flip side, the Nasdaq is more exposed to the tech sector, which has experienced a sell-off in recent weeks. As we’ve discussed in prior posts, higher rates hurt longer-duration assets like growth stocks.
Interestingly, though, the S&P 500 has been relatively unfazed by this market narrative.
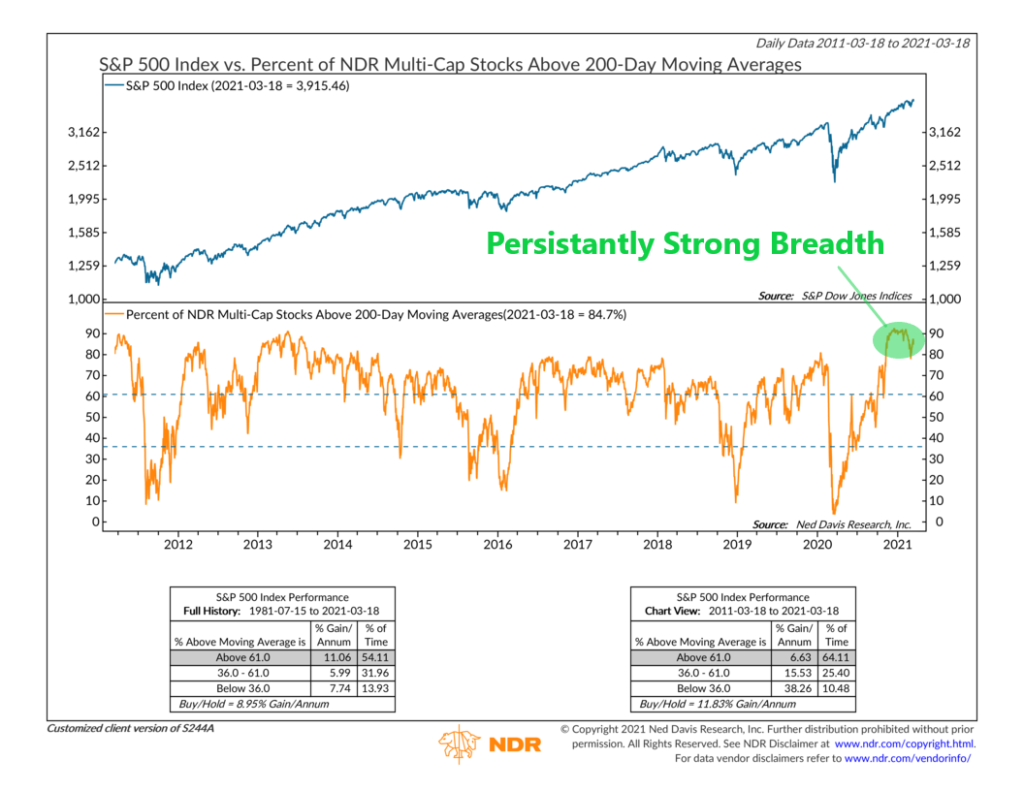
This is likely because the overall breadth in the stock market has and continues to be strong.
For example, the chart below shows the percentage of U.S. stocks trading above their average 200-day price.

In a show of strength that we haven’t seen in quite some time, this measure has been hovering around 90% since November. During the recent stock market sell-off, the reading dropped to under 80%; however, it has since rebounded and is back near the 90% mark.
On a shorter time frame, like 50 days, this measure is closer to around 67%. While obviously not as strong as the 200-day measure, it is still up from the less than 50% reading it reached during the sell-off. This is worth watching for further deterioration, however.
Of course, at some point, rising interest rates could certainly start to weigh on the broader S&P 500 index. (This is why we implement risk management tools for protection.) But in the meantime, it appears that the S&P 500 seems content to keep calm and carry on, as they say.
This is intended for informational purposes only and should not be used as the primary basis for an investment decision. Consult an advisor for your personal situation.
Indices mentioned are unmanaged, do not incur fees, and cannot be invested into directly.
Past performance does not guarantee future results.
The post Not Fazed first appeared on NelsonCorp.com.