OVERVIEW
Despite a valiant effort at a last-minute comeback on Friday, the major U.S. stock indices closed lower for the week. The S&P 500 dropped 0.51%, the Dow fell 0.98%, and the Nasdaq dipped 1.1%.
While growth stocks registered a 1.15% weekly decline, value stocks held up much better and gained 0.21%. Small-cap stocks also rallied nearly 0.7% for the week.
As for foreign stock markets, we saw a 0.14% decline in developed countries and a 3.14% collapse in emerging markets. The U.S. dollar strengthened about 0.03%.
Over in the bond market, the 10-year Treasury rate climbed to 4.5%, resulting in losses for longer-dated Treasuries. The overall bond market, however, rose about 0.05%.
Real estate had a nice week, tacking on gains of about 1.7%. Commodities, however, fell about 1.94%. Oil dipped 0.7%, gold fell 0.47%, and corn prices decreased nearly 4%.
KEY CONSIDERATIONS
Divergences – It looked like the stock market was going to end the month of May on a weak note. But then a last-minute rally on Friday helped push the S&P 500 back to less than 1% from all-time highs.
That was nice to see. But the concern is that we have seen a few bearish divergences start to form under the surface lately.
What’s a bearish divergence, you ask?
It’s a technical phenomenon that occurs when the price of an asset reaches higher highs while a technical indicator simultaneously reaches lower highs. This divergence tends to be a sign that momentum is weakening, and the asset might soon experience a downward correction or reversal.
For example, the chart below shows that while the S&P 500 surpassed its previous March high this month, the percentage of stocks within the index trading above their average 200-day price failed to confirm the message.
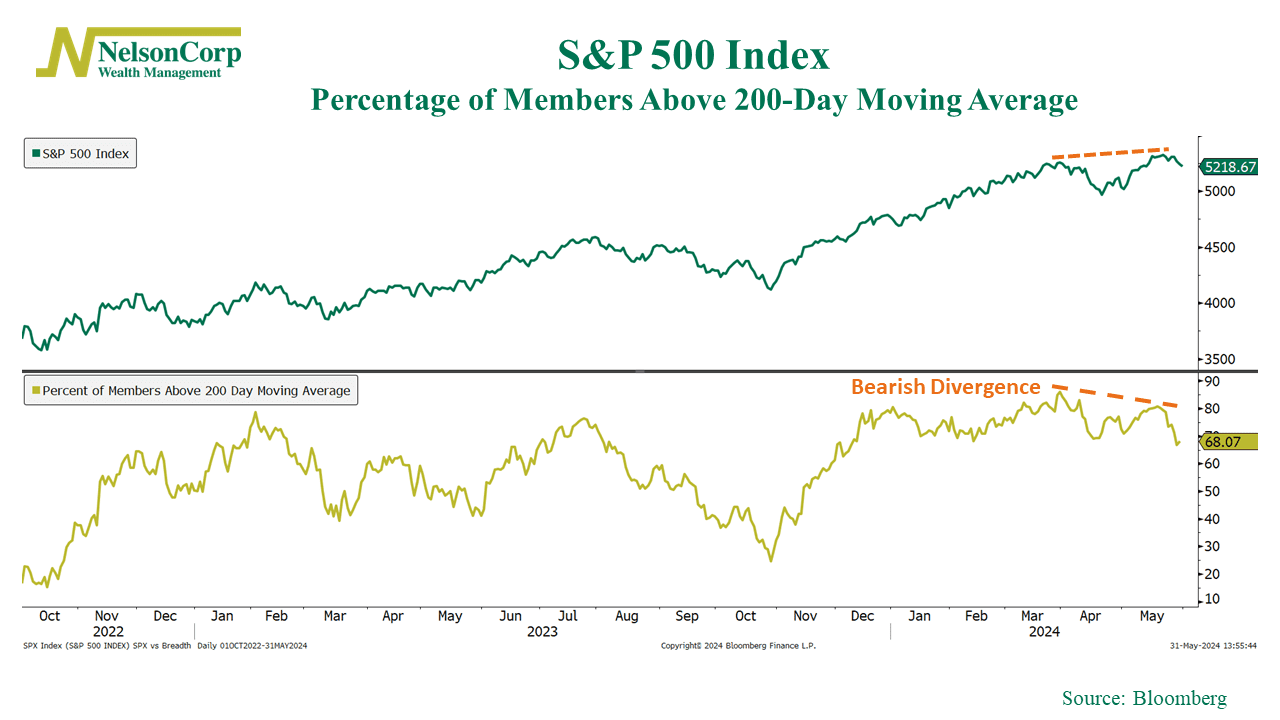
When breadth deteriorates and diverges like this, it tends to leave the market vulnerable to a pullback.
And that wasn’t the only example of a divergence. Here’s another one showing the S&P 500’s weekly close relative to its 14-week RSI (Relative Strength Index).
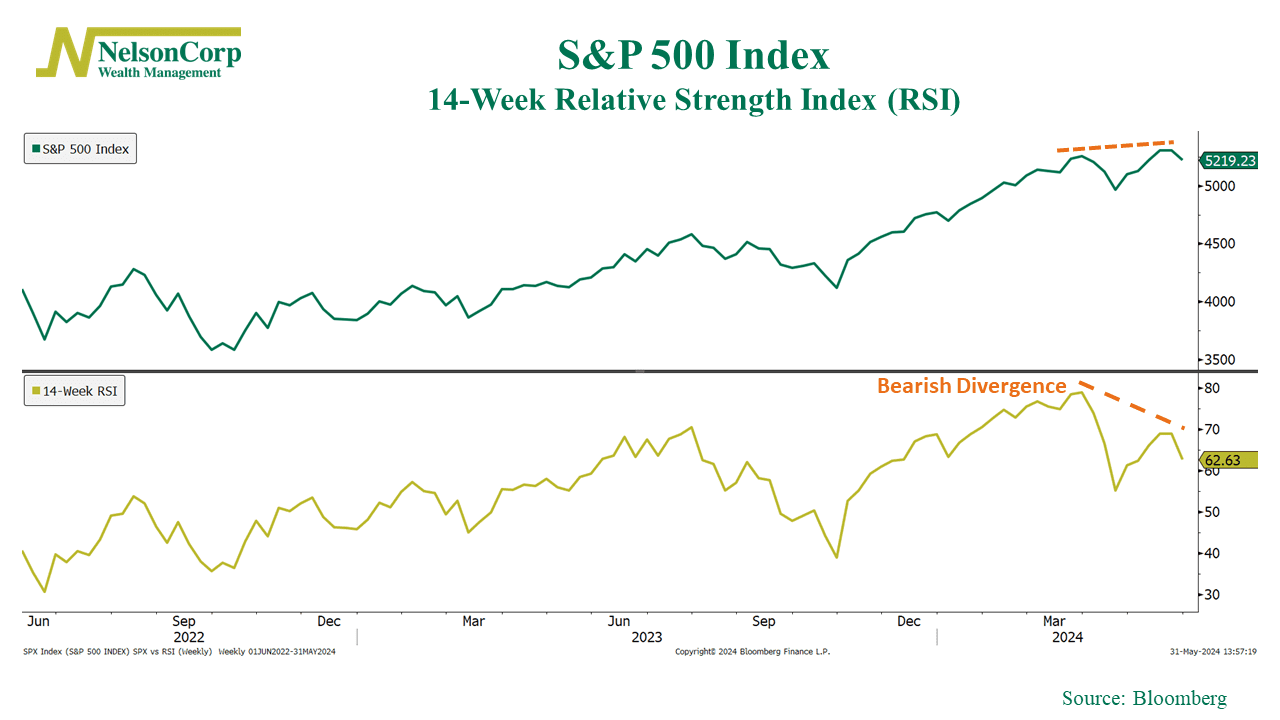
As you can see, the S&P 500 reached an all-time high, but the RSI failed to even get into its upper momentum zone (above 70). This bearish divergence puts the S&P 500 in a precarious spot for the future.
In addition, this seems to be happening amid an overall weakening in the indicators that we track in our models.
For example, our primary stock market risk model (shown as the gold line on the chart below) was about 67% bullish when we started the year. Going into last week, however, it had fallen to about 56% bullish.
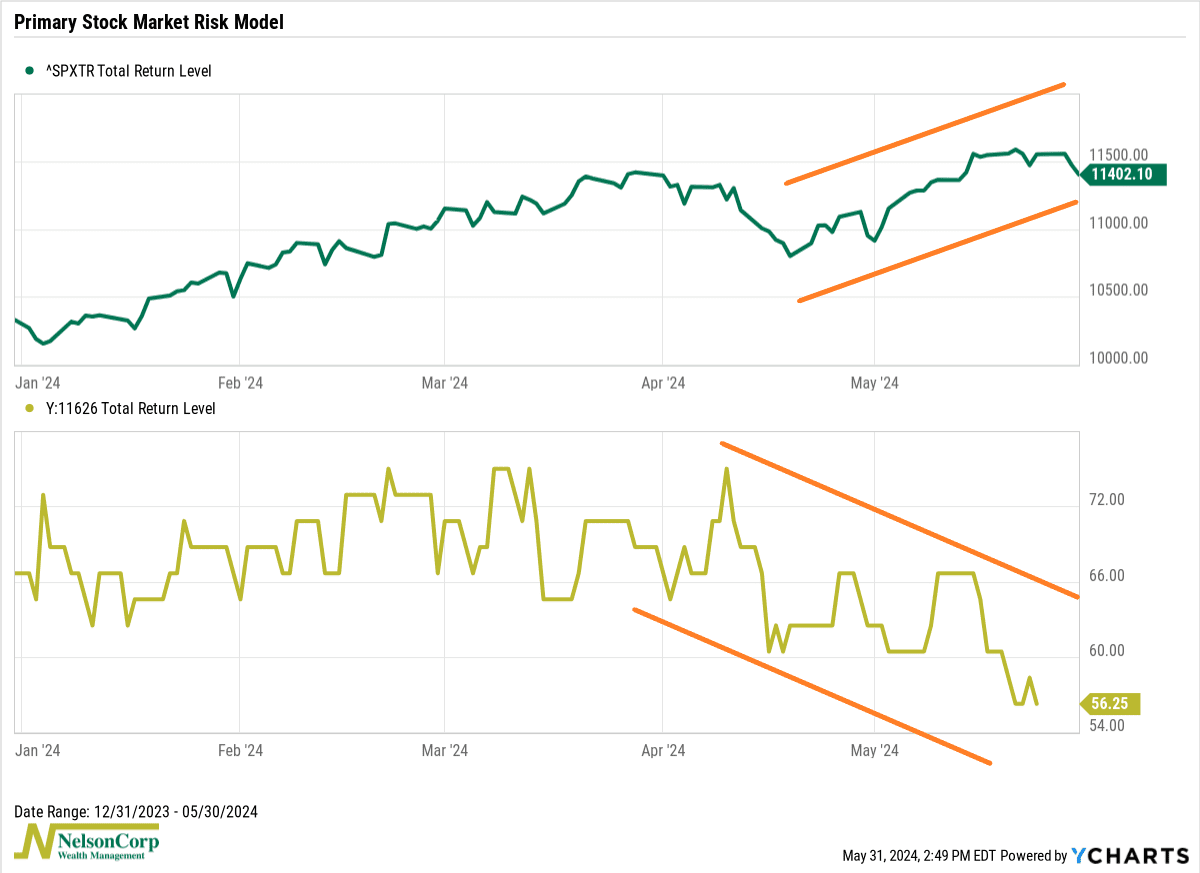
While obviously still a bullish level for the model, the trend in the reading is a bit concerning.
Plus, as you might have noticed, the model’s reading was more than 65% bullish when the S&P 500 reached a new high in late March, but by May’s new high, it had fallen to just 56%.
In other words, the model and the stock market are moving in opposite directions. Yep, you guessed it, that’s another bearish divergence.
So, the bottom line is that while the weight of the evidence continues to lean bullish, there are signs of weakening momentum amid some key technical divergences. We are still constructive on risk assets, but taking some risk off the table could make some sense if needed.
This is intended for informational purposes only and should not be used as the primary basis for an investment decision. Consult an advisor for your personal situation.
Indices mentioned are unmanaged, do not incur fees, and cannot be invested into directly.
Past performance does not guarantee future results.
The S&P 500 Index, or Standard & Poor’s 500 Index, is a market-capitalization-weighted index of 500 leading publicly traded companies in the U.S.
The post Divergences first appeared on NelsonCorp.com.