OVERVIEW
The U.S. stock market bounced back last week as expected volatility, measured by the VIX Index, fell about 11% to 20.42. The S&P 500 rose 1.5%, the Dow gained 1.8%, and the Nasdaq increased 0.7%.
Foreign stocks, however, were mixed for the week. The MSCI EAFE Index of developed country stocks surged 2.11%, whereas the MSCI EM Index of developing country stocks lost about 0.2%.
Bonds held up well as the 10-year Treasury’s yield dipped to 3.69%, down from 3.8% the week prior. Intermediate-term Treasuries saw price gains of nearly 1%, and longer-term Treasuries rose 3.3%. Corporate bonds were also up, with investment-grade issues climbing 1.5% and high-yield (junk) bonds rising 1.05%.
Commodities increased slightly by about 0.11%. Oil, down 3% for the week, held the broader index down. But gold and corn saw slight increases of 4 and 7 basis points, respectively. Real estate climbed 1.8%, and the U.S. dollar declined 0.8%.
KEY CONSIDERATIONS
Breadth & Seasonality – If you’re anything like me, you probably feel some increased “breadth” across your torso after eating Thanksgiving dinner last week.
We aren’t alone. The stock market, in a similar fashion, has seen some noteworthy increases in breadth lately.
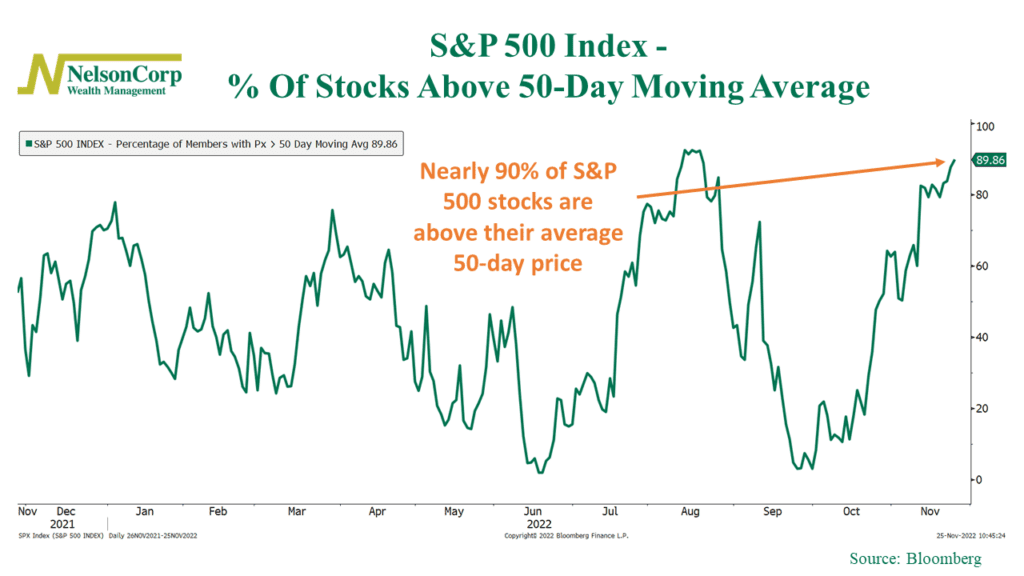
For example, as the chart below shows, the percentage of S&P 500 stocks trading above their average 50-day price has climbed from 3% to nearly 90% in less than two months.

In other words, more and more of the individual stocks that make up the stock market are participating in the rally. Historically, when this indicator has risen from less than 5% to more than 85%, like it recently did, it has been a signal of further gains to come.
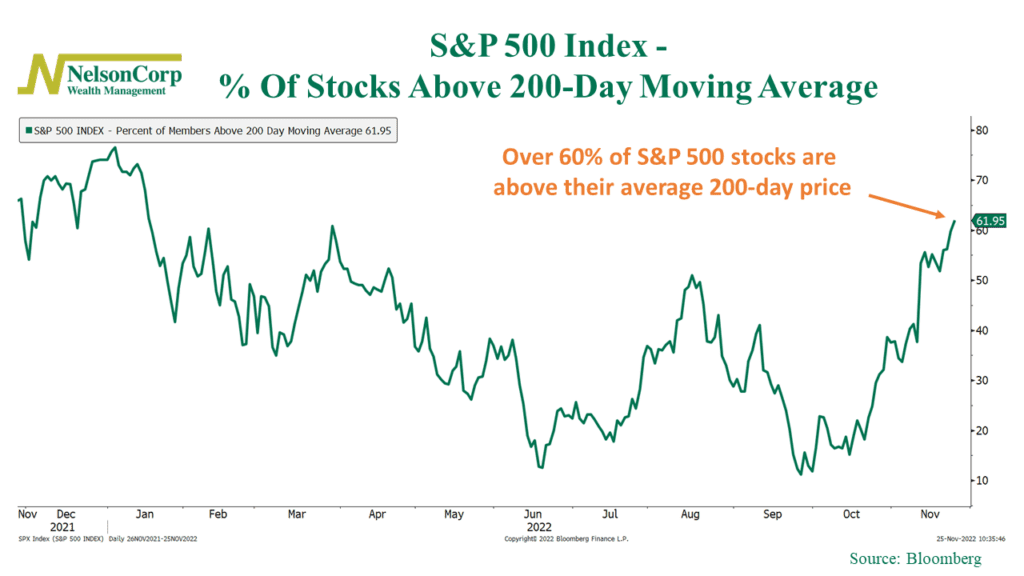
For a longer-term perspective, we can also look at the percentage of S&P 500 stocks trading above their average 200-day price, shown below.

At roughly 62%, this is the highest this measure has been since mid-January. That’s a good indication that this stock market rally might have some legs.
So, to sum up, short-term breadth has bounced from extremely low levels, and longer-term breadth is nearing year-to-date highs. Historically, this is the type of stuff you see at the start or continuation of bull market phases.
There are also favorable seasonality dynamics to be aware of, too.
Historically, November to January tends to be the year’s best 3-month span for stock market returns. This includes the narrowly defined “Santa Claus Rally,” which doesn’t occur until after Christmas.
On top of that, this year also happens to fall in the “sweet spot” of the 4-year presidential cycle. This is defined as the fourth quarter of the midterm year through the second quarter of the pre-election year.
So, overall, the seasonality statistics look strong, at least theoretically. This could provide a much-needed tailwind for stock returns as we end the year.
The bottom line? While the market’s overall trend is still biased to the downside, things look more favorable from a breadth and seasonality perspective. Given this backdrop, a continued rally in the short term is not out of the question, assuming the price action cooperates.
This is intended for informational purposes only and should not be used as the primary basis for an investment decision. Consult an advisor for your personal situation.
Indices mentioned are unmanaged, do not incur fees, and cannot be invested into directly.
Past performance does not guarantee future results.
The post Breadth & Seasonality first appeared on NelsonCorp.com.