OVERVIEW
We continued to see financial assets rally last week. The VIX Index, a measure of stock market volatility, continued to fall and is currently trading near pre-pandemic lows.
In the U.S., we saw the S&P 500 gain 0.77%, the Nasdaq increase 0.4%, and the Dow Jones Industrial Average surge 2.4%. Sure enough, value stocks rose nearly 2% versus a roughly 0.3% gain for growth stocks.
Foreign stock markets were also up for the week. Developed country stocks rose over 1%, and emerging markets edged about 0.1% higher.
Bonds joined the party as well. The 10-year Treasury rate dropped to roughly 4.2%, resulting in gains of roughly 1.8% for investment-grade bonds in the United States. While shorter-term Treasuries rose about 0.4%, long-term Treasuries surged about 3.7%.
Real estate had a monster week, rising nearly 5%. Commodities, on the other hand, were down. Oil dipped about 2%, and corn fell 0.3%. Gold, however, rose 3.5%. As for the U.S. dollar, it was essentially flat for the week.
KEY CONSIDERATIONS
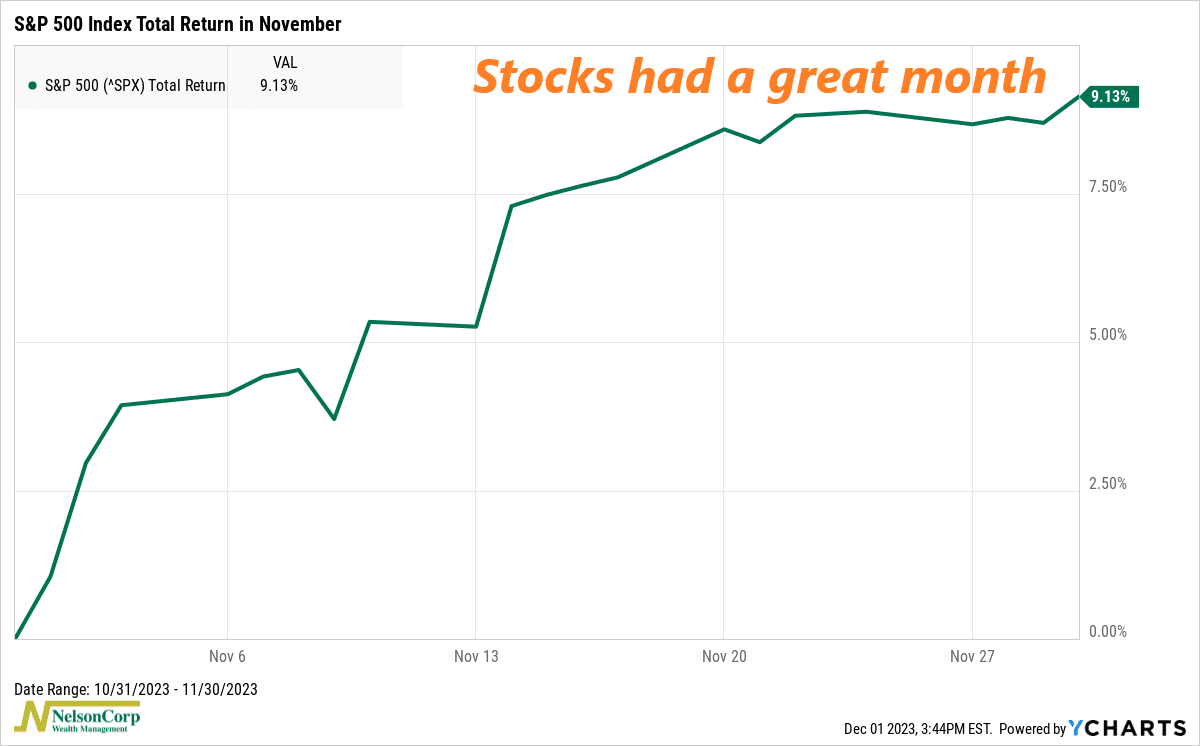
Rate Cuts – November was a great month for the stock market. The S&P 500 stock index rose roughly 9%, the 7th best monthly gain in the last 30 years.
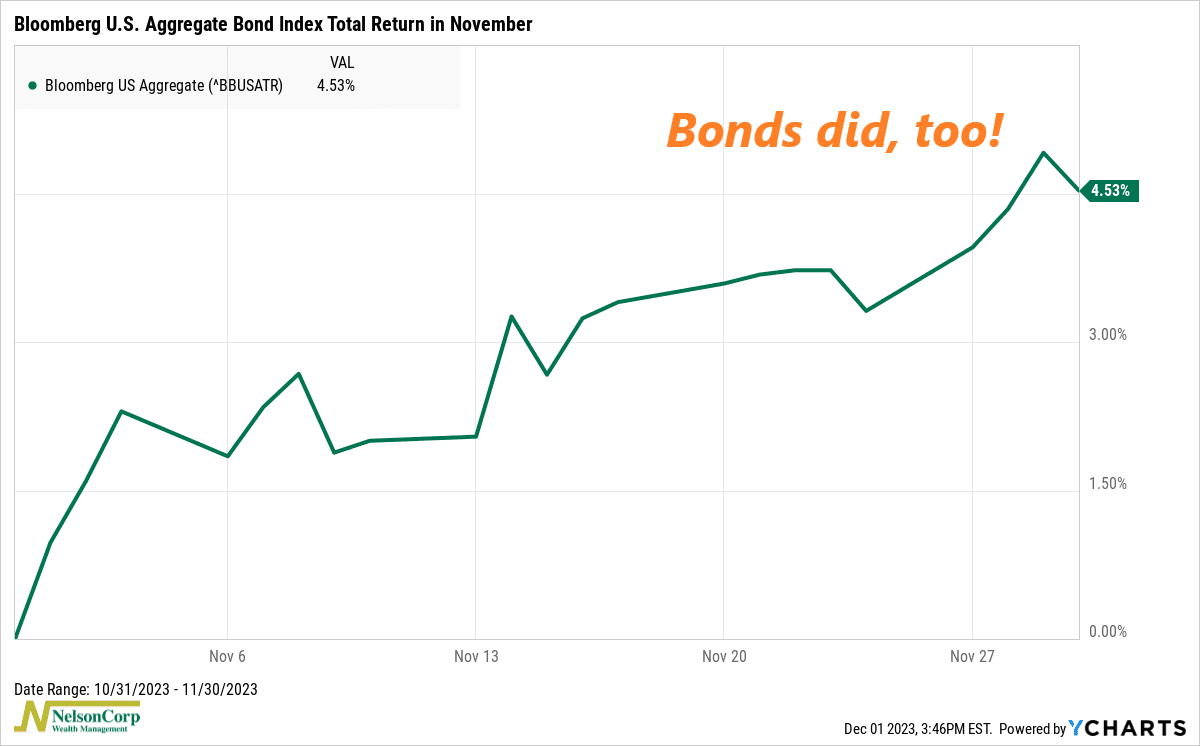
But it wasn’t just the stock market. Bonds had a great month, too. The Bloomberg U.S. Aggregate Index—the benchmark index for investment grade bonds in the U.S.—rose more than 4.5%, its best month of returns since the 1980s.
Basically, we saw a bit of an “everything rally” last month. And this was mainly because we continue to see signs that inflation is coming down, economic growth is holding up, and—most importantly for investors—that the Fed is done, or just about done, with its rate hikes.
In fact, as the chart below shows, the market now expects the Fed to start cutting—yes, cut—rates as soon as the first half of next year. By the end of 2024, the market expects the Fed to have lowered the Fed Funds rate by a whole percentage point!
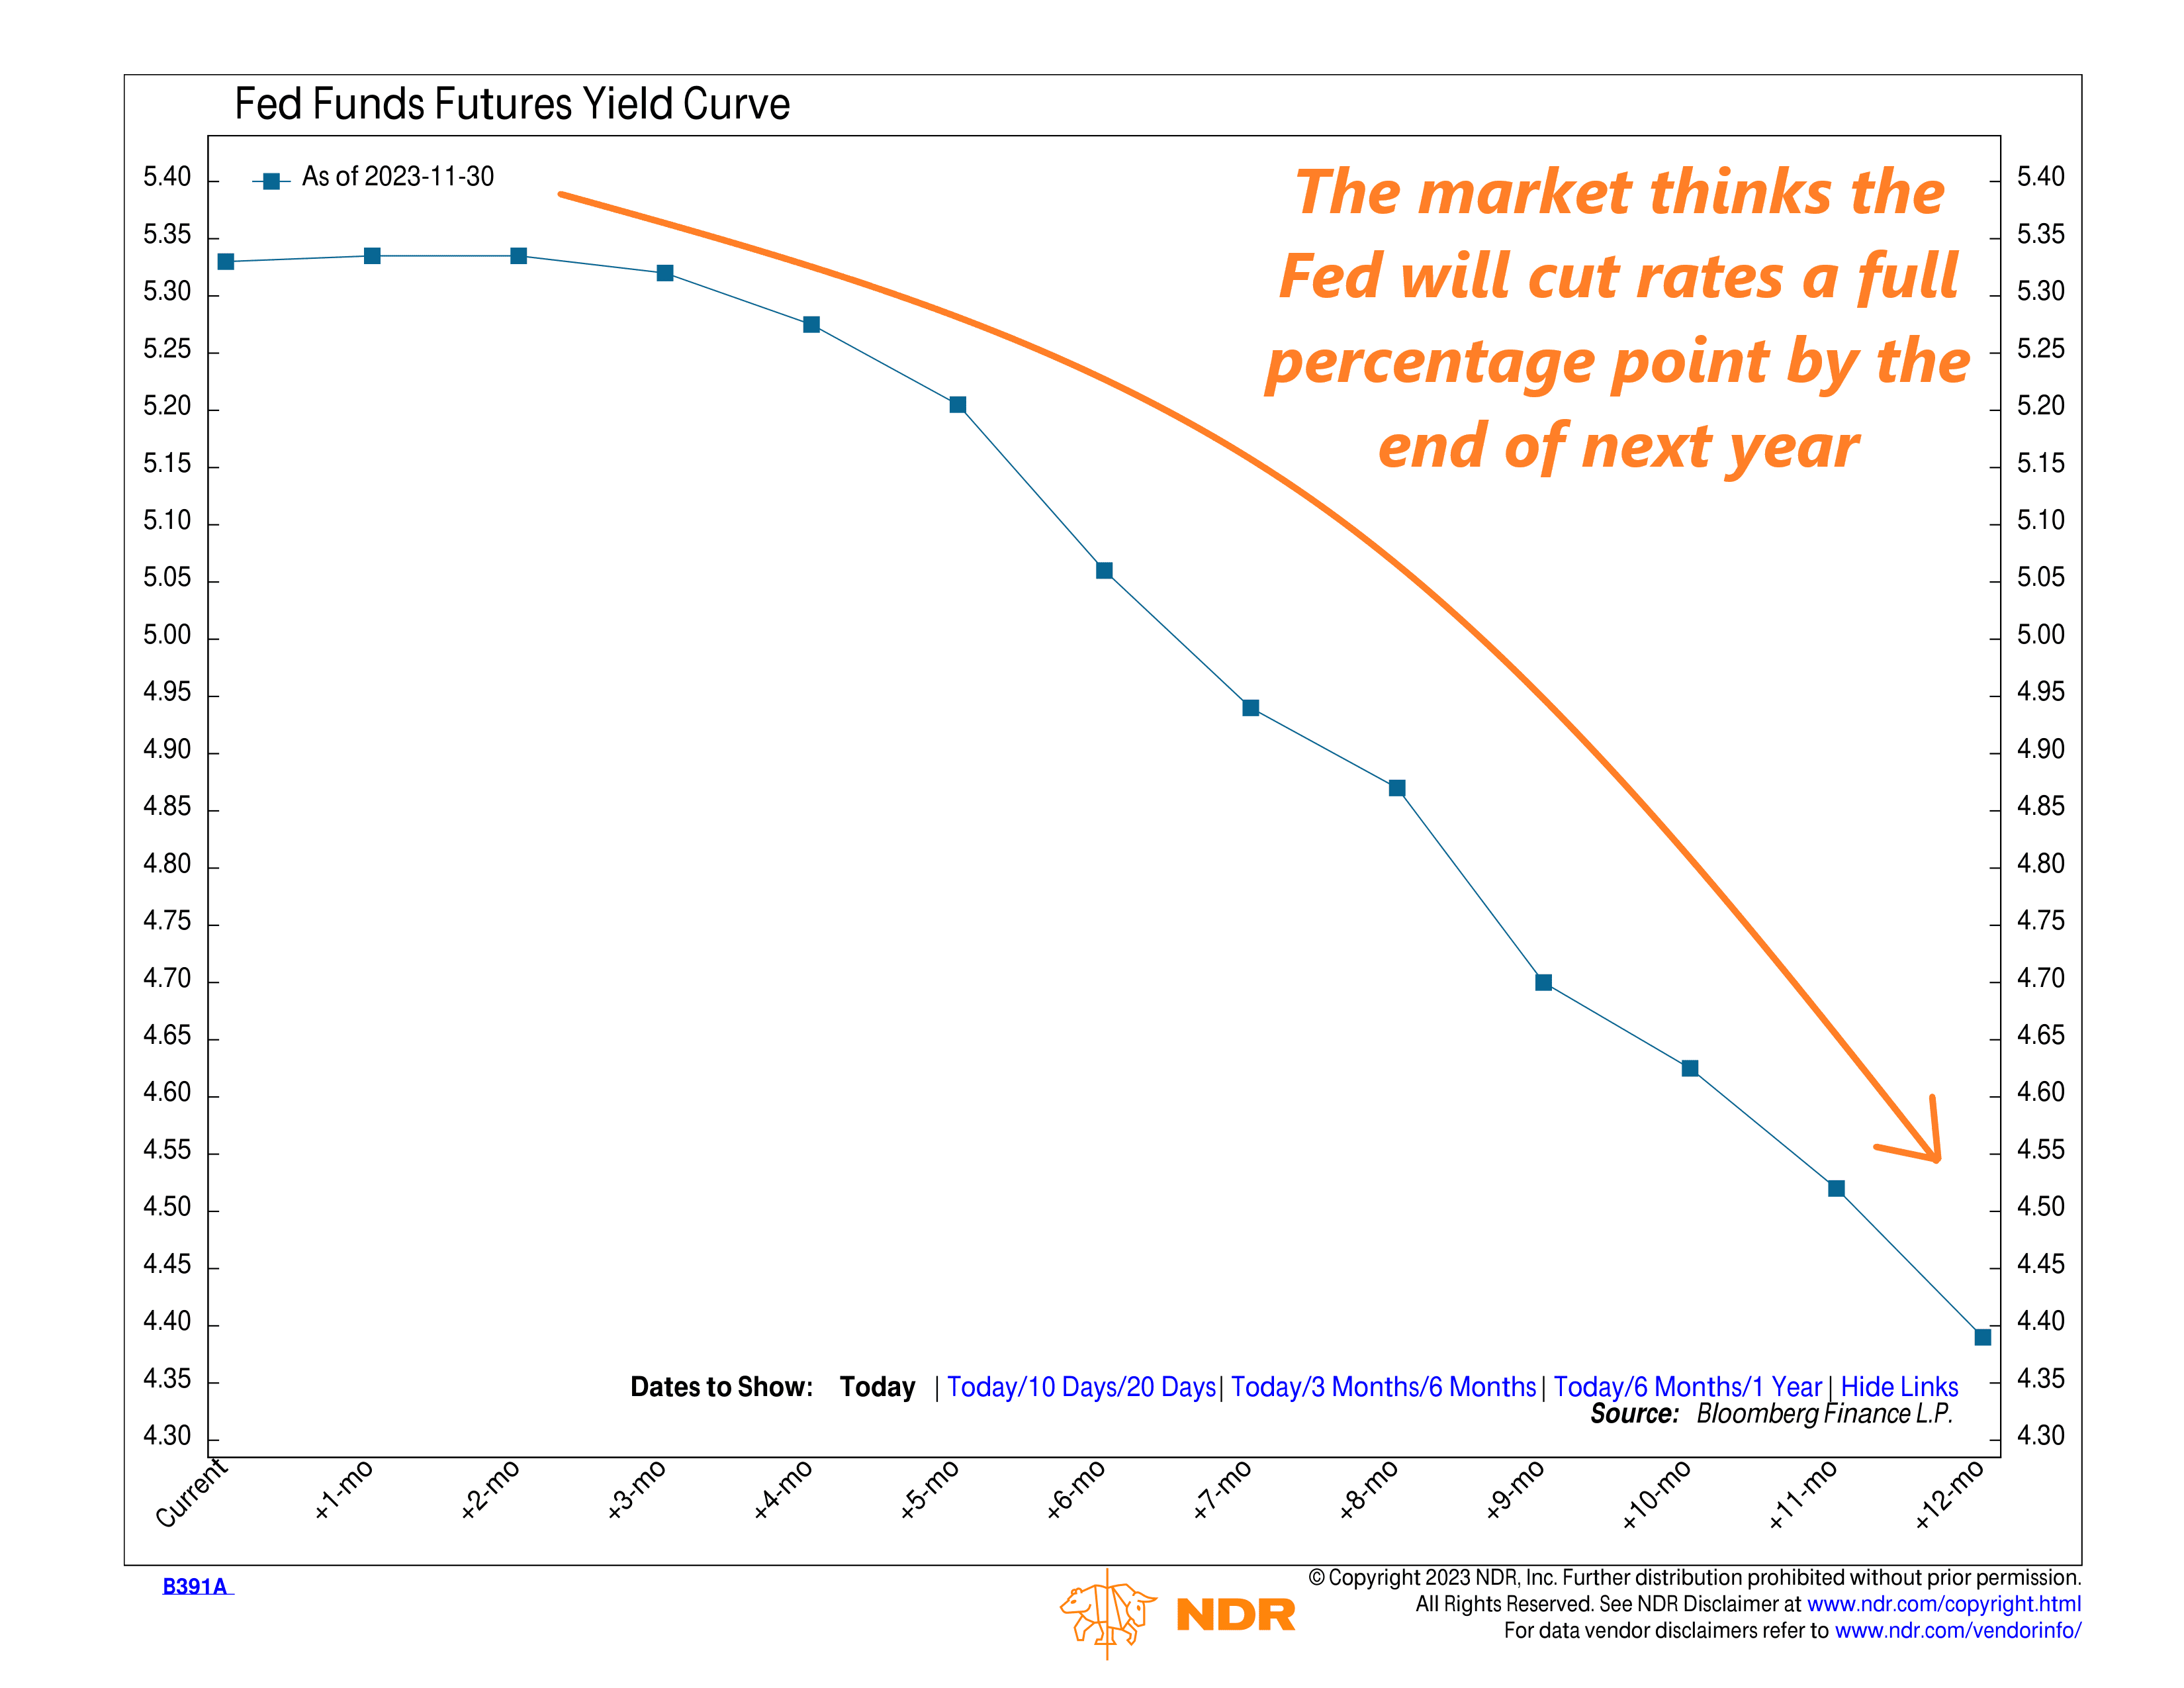
As long as the Fed isn’t lowering rates because of an economic recession—and it doesn’t appear that the market thinks that will be the case—then this should all be bullish for stocks.
And that’s likely why the market has rallied as strongly as it has in recent weeks.
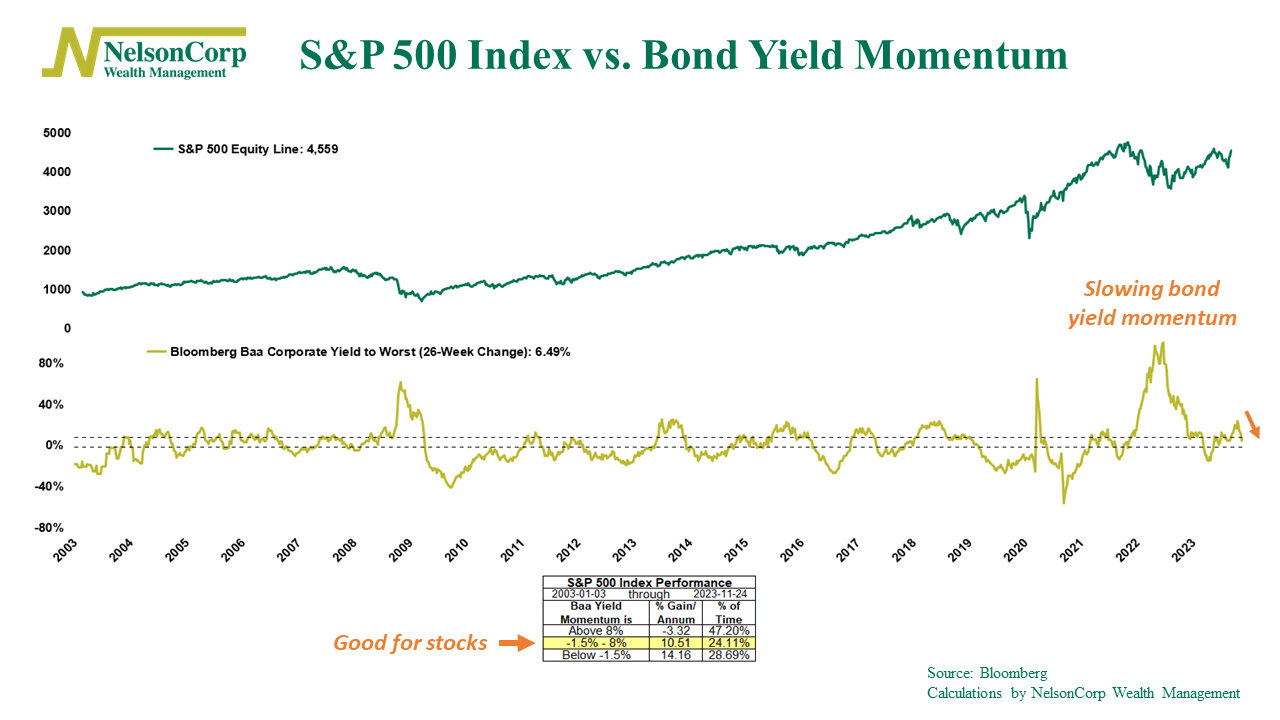
Basically, the market loves lower interest rates. And as our Indicator Insights blog post this week showed, interest rate momentum has slowed substantially—which is bullish for stock prices.
You know what else is bullish? Improving breadth. The chart below shows new highs minus lows on the New York Stock Exchange, smoothed by 20 days. When this measure gets greater than zero, it means internal breadth is improving in the stock market—and the S&P 500 tends to trend higher when this is the case.
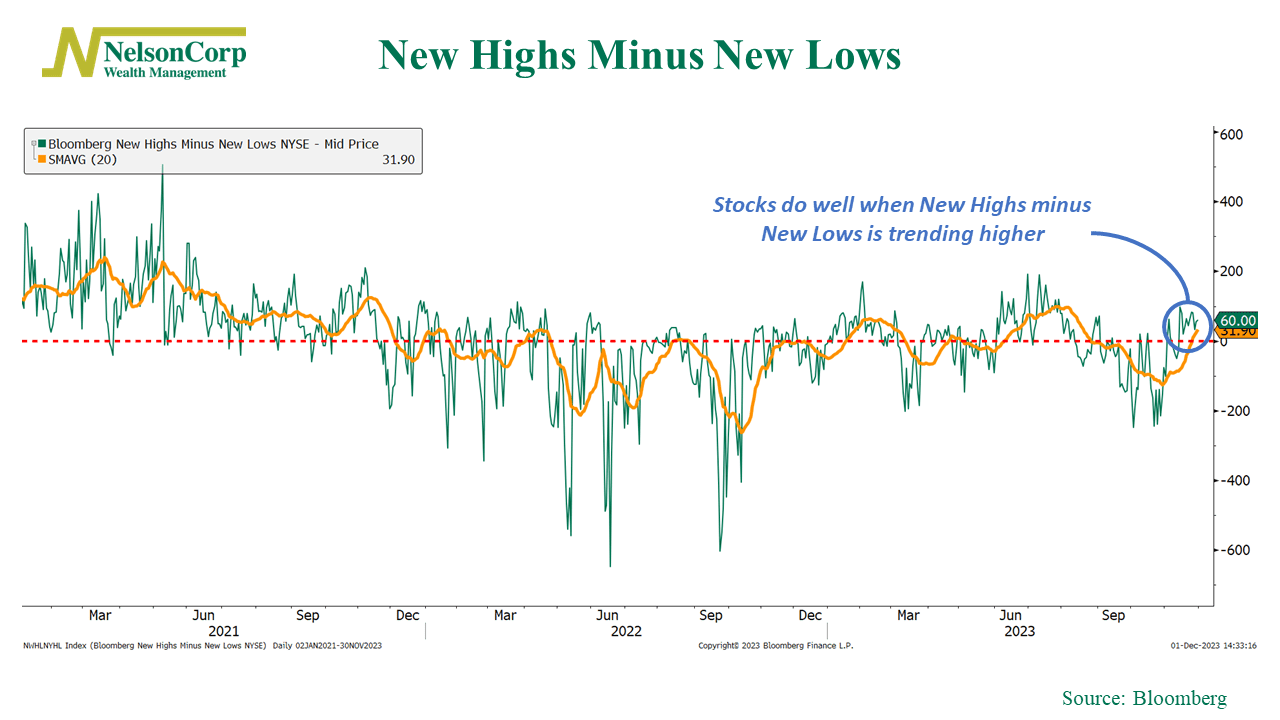
In other words, although the market has been somewhat quiet the past week or so, we’ve continued to see a lot of internal improvement happen beneath the surface. Couple that with the fact that investors are increasingly convinced that the Fed is done raising rates, and you’ve got a recipe for solid stock market gains.
This is intended for informational purposes only and should not be used as the primary basis for an investment decision. Consult an advisor for your personal situation.
Indices mentioned are unmanaged, do not incur fees, and cannot be invested into directly.
Past performance does not guarantee future results. The S&P 500 Index, or Standard & Poor’s 500 Index, is a market-capitalization-weighted index of 500 leading publicly traded companies in the U.S.
The post Rate Cuts first appeared on NelsonCorp.com.