OVERVIEW
More record highs for the U.S. stock market last week; the S&P 500 rose 1.7%, the Dow Jones Industrial Average gained about 1%, and the Nasdaq Composite rose 2.1%.
Digging deeper, we see small-cap and value stocks taking the lead in the U.S., gaining 2.4% and 1.9%, respectively.
For the most part, foreign stocks performed similar to their U.S. counterparts, with developed country stocks gaining a little over 1% and emerging market stocks rising about 1.6%.
Bonds did less well on the week. By Friday, the yield on the 10-year U.S. Treasury note rose to 0.97%. Intermediate- to long-term Treasury bonds and investment-grade bonds suffered the worst of the declines.
However, most commodities continue to benefit from a weak U.S. dollar — which fell more than 1% last week. Although corn dropped more than 3%, gold rose 2.75%. And oil gained 1.2% after OPEC and a group of Russia-led oil producers agreed to increase output by a smaller amount than expected next month.
KEY CONSIDERATIONS
Bandwidth Test – November was a terrific month for stocks. The S&P 500 rose 10.8 percent, its best November since 1928.
According to some indicators, though, that surge might have pushed stocks too far, leaving them more vulnerable for a short-term pullback.
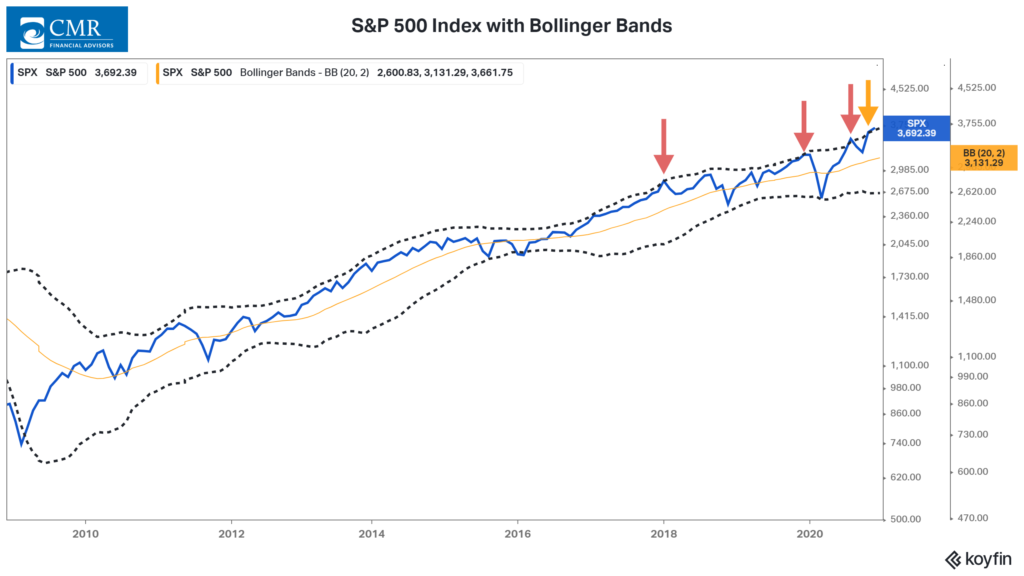
To visualize this, we present a chart of monthly returns for the S&P 500 with Bollinger Bands applied. Bollinger Bands are a classic technical tool that places volatility bands above and below a moving average. These bands expand and contract as volatility changes, allowing us to see when an asset is moving on the outer edge of its more recent trading range.

The strong performance in November has once again pushed the S&P 500 above the upper band, indicating a potentially overbought market.
The arrows on the chart show the last three times the S&P 500 closed higher than the upper monthly Bollinger Band. Following each occurrence, the index had negative returns for at least the next two months.
However, at the same time, it takes strength to reach an overbought level, and a strong market in an uptrend can continually test and retest these upper bounds as it marches forward.
Indeed, the weight of the evidence from the majority of our primary indicators suggests the environment is still constructive for risk assets.
The rally in November was much broader than in previous months. Nearly every stock in the S&P 500 is in a technical uptrend, with roughly 93 percent of them trading above their average 200-day price, the highest in seven years!
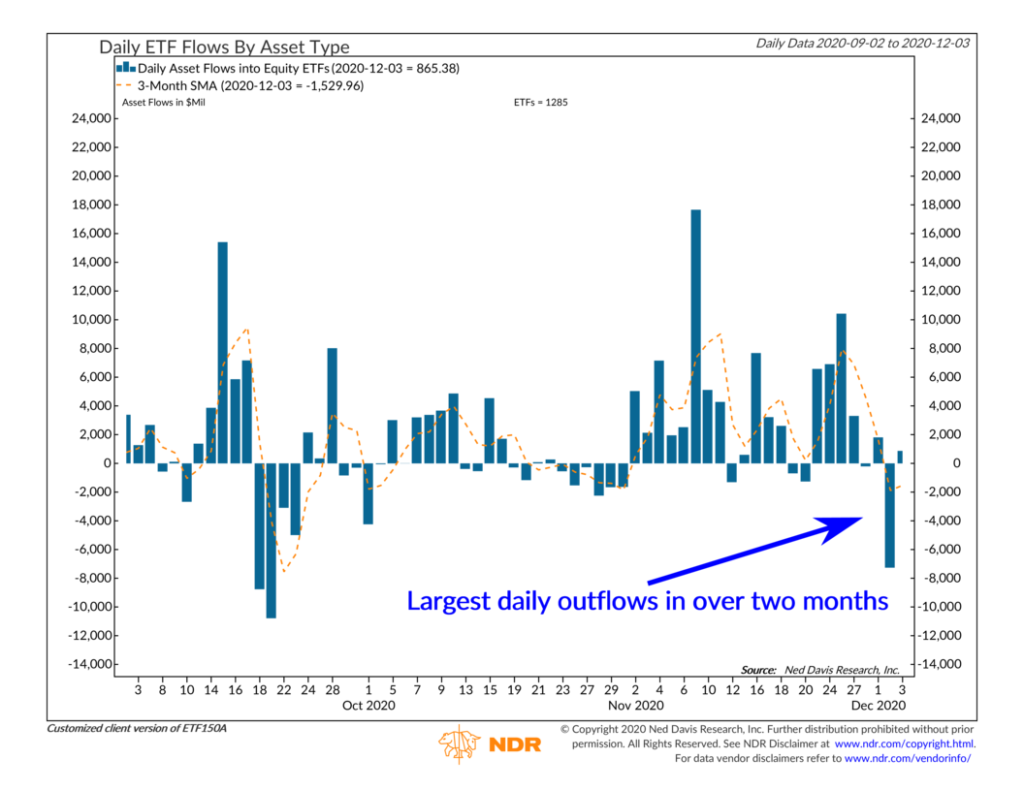
A pushback to this bullish case is that there is no shortage of optimism. When sentiment shows excessive optimism, we like to look for a change in attitudes that might signal a reversal point. After record inflows in November, equity ETFs just saw their largest daily outflows in over two months.

However, it’s not clear that this will be enough to break the current uptrend in stock prices. And flows in and out of ETFs don’t necessarily translate into trading activity that affects returns.
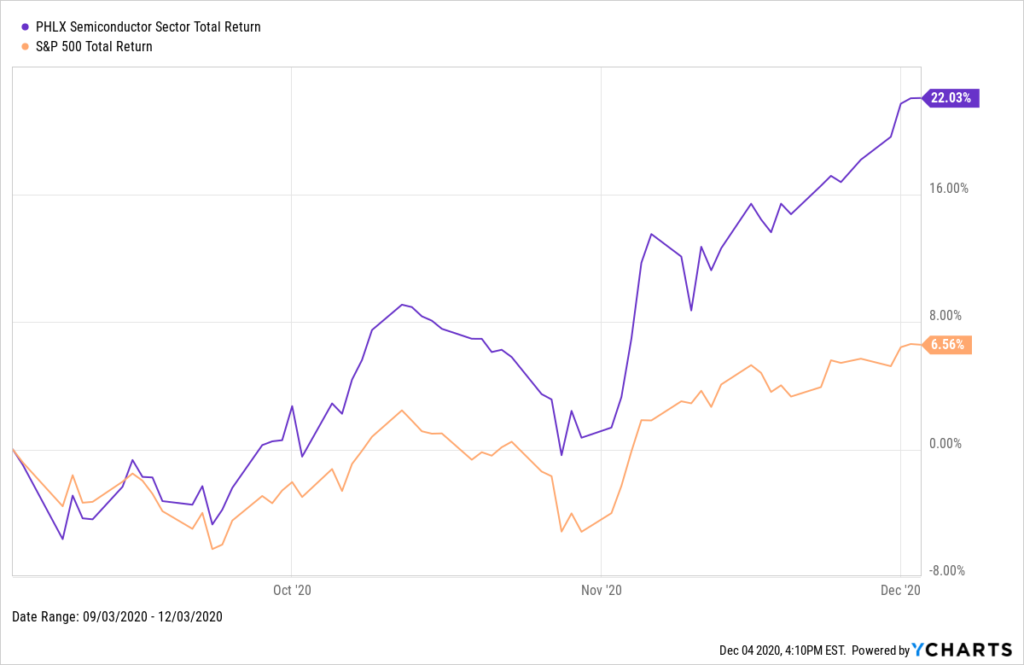
As a final thought, the strong performance from cyclical, economically-sensitive industries such as semiconductors is an encouraging sign. The PHLX Semiconductor Index — which is comprised of companies involved in the manufacturing, design, and sale of semiconductors — has rallied in a particularly strong fashion relative to the broader stock market over the past few months.

This trend may continue, which could be a boost for both the stock market and the economy in the coming years.
This is intended for informational purposes only and should not be used as the primary basis for an investment decision. Consult an advisor for your personal situation.
Indices mentioned are unmanaged, do not incur fees, and cannot be invested into directly.
Past performance does not guarantee future results.
The post Bandwidth Test first appeared on NelsonCorp.com.