OVERVIEW
U.S. stocks got crushed last week, with the S&P 500 dropping 5.6% over the past five days, its worst-ever loss in the week leading up to a presidential election.
The Dow fell over 6%, and the Nasdaq dropped around 5.5% amid disappointing earnings from the big tech companies.
International stocks didn’t fare much better. Developed country stocks fell around 5.5%, and emerging market stocks dropped about 3.5%.
Long-term Treasuries didn’t provide much of a pop as a haven asset, declining moderately for the week. The yield on the 10-year Treasury jumped to 0.87%, its highest level since June.
Even gold saw declines for the week, dropping roughly 1.3%.
Commodities overall had a bad week, driven lower by an over 9% collapse in oil prices.
The U.S. dollar, however, had a strong week, gaining over 1%.
KEY CONSIDERATIONS
A Case of the Jitters – The markets are on edge. The S&P 500 Volatility Index (VIX) jumped from around 27.5 to over 40 in a matter of a few days last week. The S&P 500 Index itself remains more than eight percent off its all-time highs set near the beginning of September.
So what’s all the fuss? Besides the upcoming election, a few risks are bubbling to the surface that has people concerned.
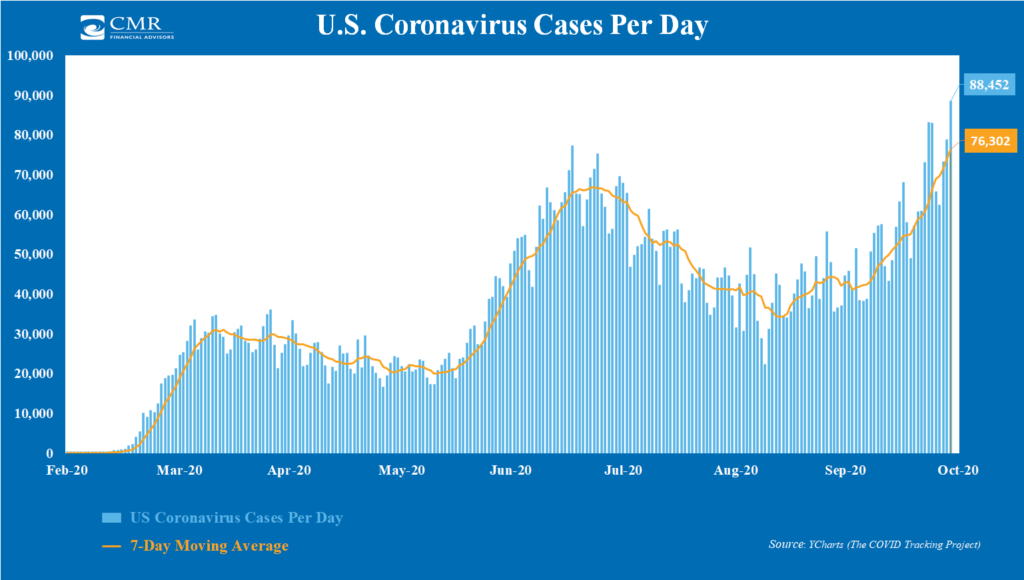
For example, a new record high in coronavirus infections in the U.S. has investors spooked, bringing back memories of February and March earlier this year. The 7-day moving average of new cases per day hit a fresh high of over 76,000 last week. This is higher than the previous two peaks.

Cases are rising fast in other countries and sparking new lockdowns in Europe that threaten economic growth. Investors are concerned that the U.S. might soon follow suit.
Even without lockdowns, there are signs that economic growth in the United States has begun to slow.
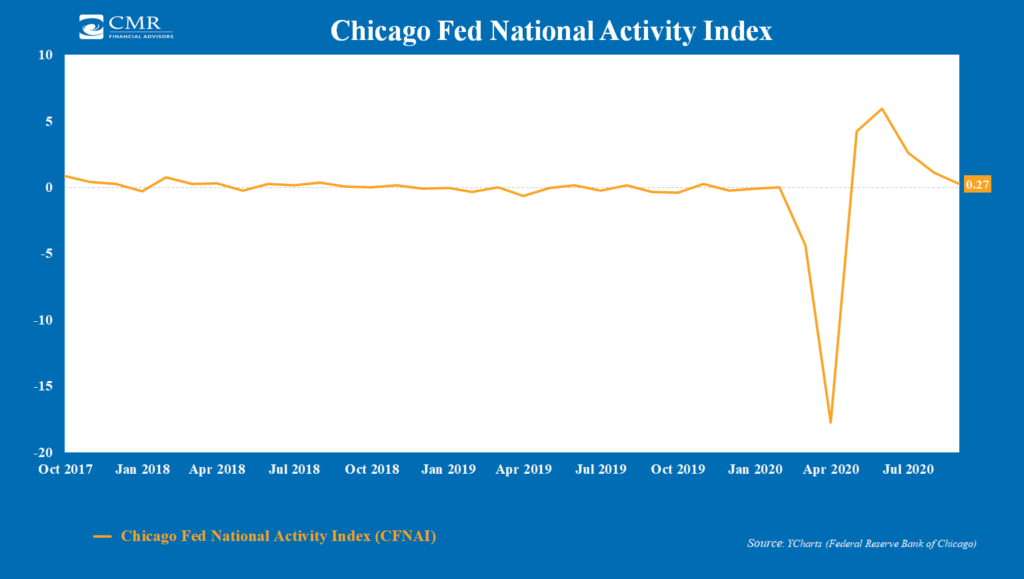
The Federal Reserve Bank of Chicago has developed a monthly index of about 85 existing national economic activity indicators, called the Chicago Fed National Activity Index (CFNAI), to gauge overall economic activity in real-time.
A reading of zero for the CFNAI indicates a “goldilocks” situation for the economy, neither too hot nor too cold. A reading over zero corresponds to growth above trend, and a negative reading indicates below-trend growth.
By April, the index had fallen to about -18. It subsequently rebounded to about 5.93 in June. However, it has fallen every month since then and is currently just barely above zero.

Digging in a little deeper, the Chicago Fed also breaks down the components of the CFNAI into a diffusion index. This index acts more like a leading indicator by revealing the degree to which a change in the monthly index is spread out among its 85 constituents.
This also decreased in the latest reading. While 40 indicators improved from August to September, 45 of them deteriorated, a sign of slowing momentum.
The takeaway from the CFNAI is that the economy has improved, but it isn’t out of the woods yet.
And the market, in its volatile way, is trying to determine how this crazy year is going to end.
This is intended for informational purposes only and should not be used as the primary basis for an investment decision. Consult an advisor for your personal situation.
Indices mentioned are unmanaged, do not incur fees, and cannot be invested into directly.
Past performance does not guarantee future results.
The post A Case of the Jitters first appeared on NelsonCorp.com.